Severe drought impacts creek flow, groundwater levels, and habitat with less than half of average rainfall recorded
Summary of 2025 Water Year: Oct 1st, 2024 – Sep 30th, 2025
The scenic desert flows were scarce this water year. By March 2025, the rainfall data indicated it had been the driest six months on record. During the first 6 months of the 2025 water year, less than an inch of rain (0.91 inches) fell between October 1st, 2024 and March 31st, 2025. The total rainfall for this water year was 4.16 inches (NOAA), most of which fell in July 2025 (1.88 inches). This is less than half of our annual average (10.61 inches).
Other than the occasional ponding of rainfall, only the waterways that were supplied by treated wastewater or had consistent groundwater connection saw surface flow (water moving along the earth’s surface) across the Tucson basin. Groundwater connection occurs when water below ground, usually stored in an aquifer or underground pool of water, is full and connects to the surface, then flows above ground. As is highlighted in this year’s report, Sabino Creek, Ciénega Creek, and effluent-fed sites along the Santa Cruz River are the spaces with water permanence throughout the year. Other areas, including shallow groundwater sites like the Wentworth Bosque along the Tanque Verde Creek and the Rillito River at Craycroft Road, did have the occasional flow day. However, due to less than average rainfall the amount of flow was nowhere near what we typically would expect this water year.
In the 2025 water year report, we highlight data trends from our Flow365 Monitors including information about the Santa Cruz River at St. Mary’s Road and at Twin Peaks Road; Agua Caliente Creek at Milagrosa Lane; Pantano Creek at Tanque Verde Road; the Cañada Del Oro River at 1st; and Ciénega Creek at Marsh Station Road.
Methodology
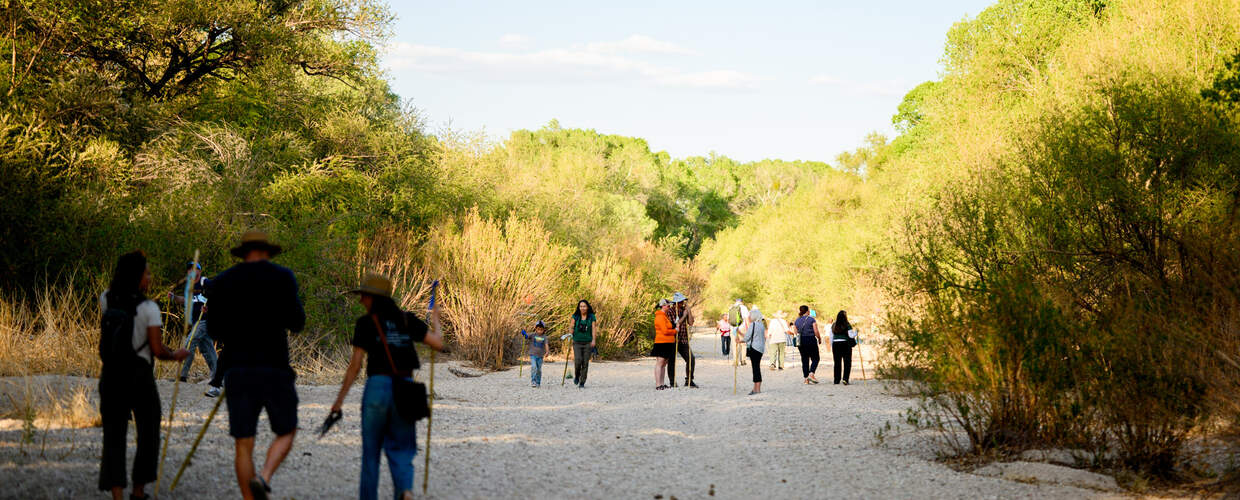
Throughout the water year, over 80 community scientists in our Flow365 program were capturing flow data for 47 sites across specific streams throughout the Tucson basin. This community science operation is led by trained volunteers from our River Run Network: a group of community members working together to restore Tucson's heritage of flowing creeks and rivers.
These monitors use a 0-6 scale to numerically represent the amount of water they see in the river. According to this scale, each value is associated with a specific amount of observed water movement:
0: no water present
1: standing water but no movement
2: shallow water movement between pools
3: low flow or shallow moving water
4: moderate flow or almost bank-to-bank flow
5: high flow or bank-to-bank flow:
6: flood flow, or when the water overflows the banks of a river system.
While agencies such as Pima County Regional Flood Control and U.S. Geological Survey have flow gauges at several locations across Tucson to measure surface flows and be able to alert the public about flooding, the data our Flow365 Monitors have been collecting since 2016 fills a gap in this data by recording water presence during periods of lower flow not detectable by the stream gages and across more locations between these gauges. Our program helps capture when water starts and stops at different times of year and helps us understand the unique nature of our desert rivers, including how they respond to changes in precipitation, groundwater levels, and management actions.
Our Flow365 Monitors collect data at least once a month, but often weekly or even daily during periods of changing flow. Because of this consistent data collection, we are able to correlate the flows in our creeks and rivers with rain and snowfall, painting a more complete picture of the health of Tucson’s creeks and rivers.
The Flow365 data set can shed light on local drought triggers and inform drought response as well as climate resilience strategies. Over time, this data also helps us determine the impact of collective conservation actions (e.g. groundwater conservation, enhanced stormwater recharge, and floodplain restoration) on creek flow as we strive towards our long-term goal of restoring Tucson’s heritage of flowing creeks and rivers.
This data is used to support the Santa Cruz Watershed Collaborative’s (SCWC) Watershed Restoration Plan and tracking of watershed health indicators (1). The data collected by the Flow365 Monitoring Program also supports Pima Prospers 2025(4) goals to protect groundwater-dependent ecosystems and shallow groundwater areas and City of Tucson’s 2100 One Water Plan (2) and Tucson’s Climate Resilience Plan(3).
(1) Santa Cruz Watershed Collaborative: People working together to ensure a natural heritage of healthy urban watersheds with flowing rivers and creeks.
(2) 2100 One Water Plan: The One Water approach treats all water resources as equally important, including surface water, groundwater, recycled water, and rain and stormwater harvesting.
(3) Tucson’s Climate Resilience Plan: The Climate Action Plan—known as Tucson Resilient Together—will provide a strategic pathway to reduce the City’s emissions to net zero by 2030, explain the anticipated impacts of climate change across the City, identify the communities that will be most vulnerable to those impacts, and provide strategies that will assure that Tucson can adapt and be resilient to the impacts of climate change – now and in the future.
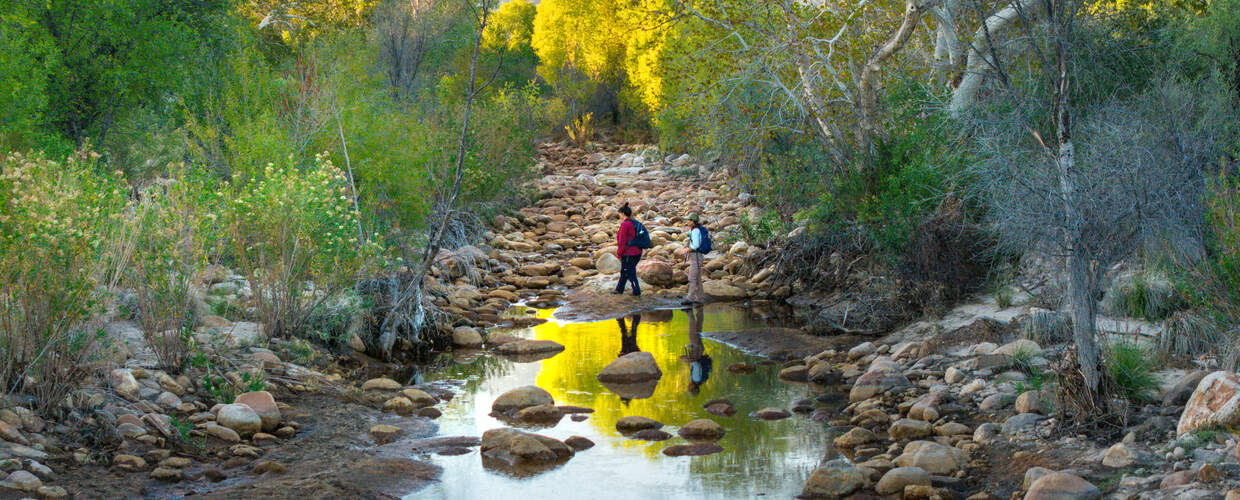
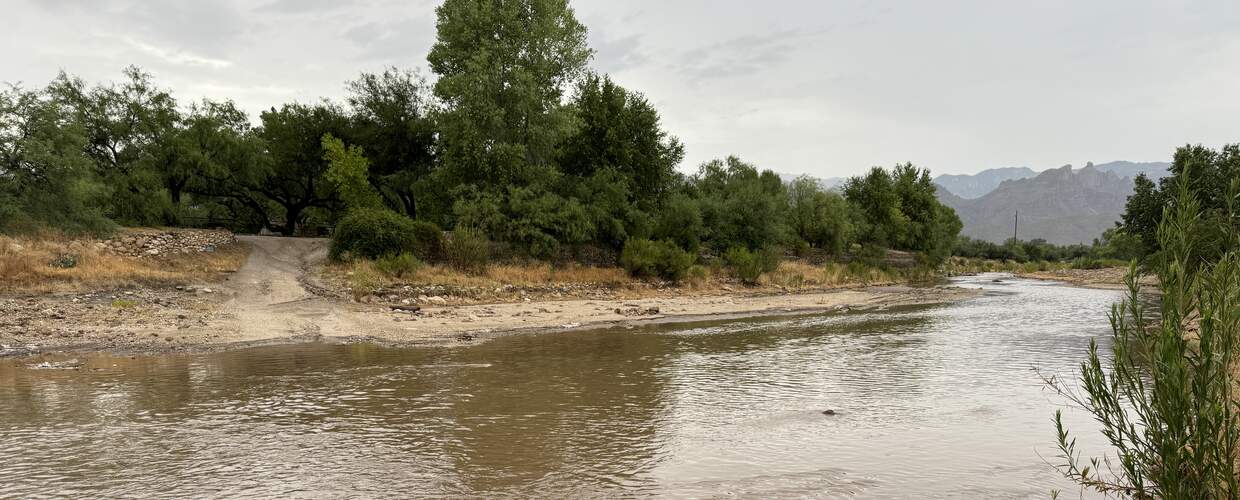
Sabino Creek
Our monitors observe several sites at the base of the Catalina Mountains. On the northeast side of Tucson, they capture data from Bear Creek and Lower Sabino Creek. These creeks start in the mountains, with rain and snowmelt feeding surface flows. When the creeks move into the valley, there are some places where shallow groundwater aquifers also support surface flow in addition to rain and snowmelt.
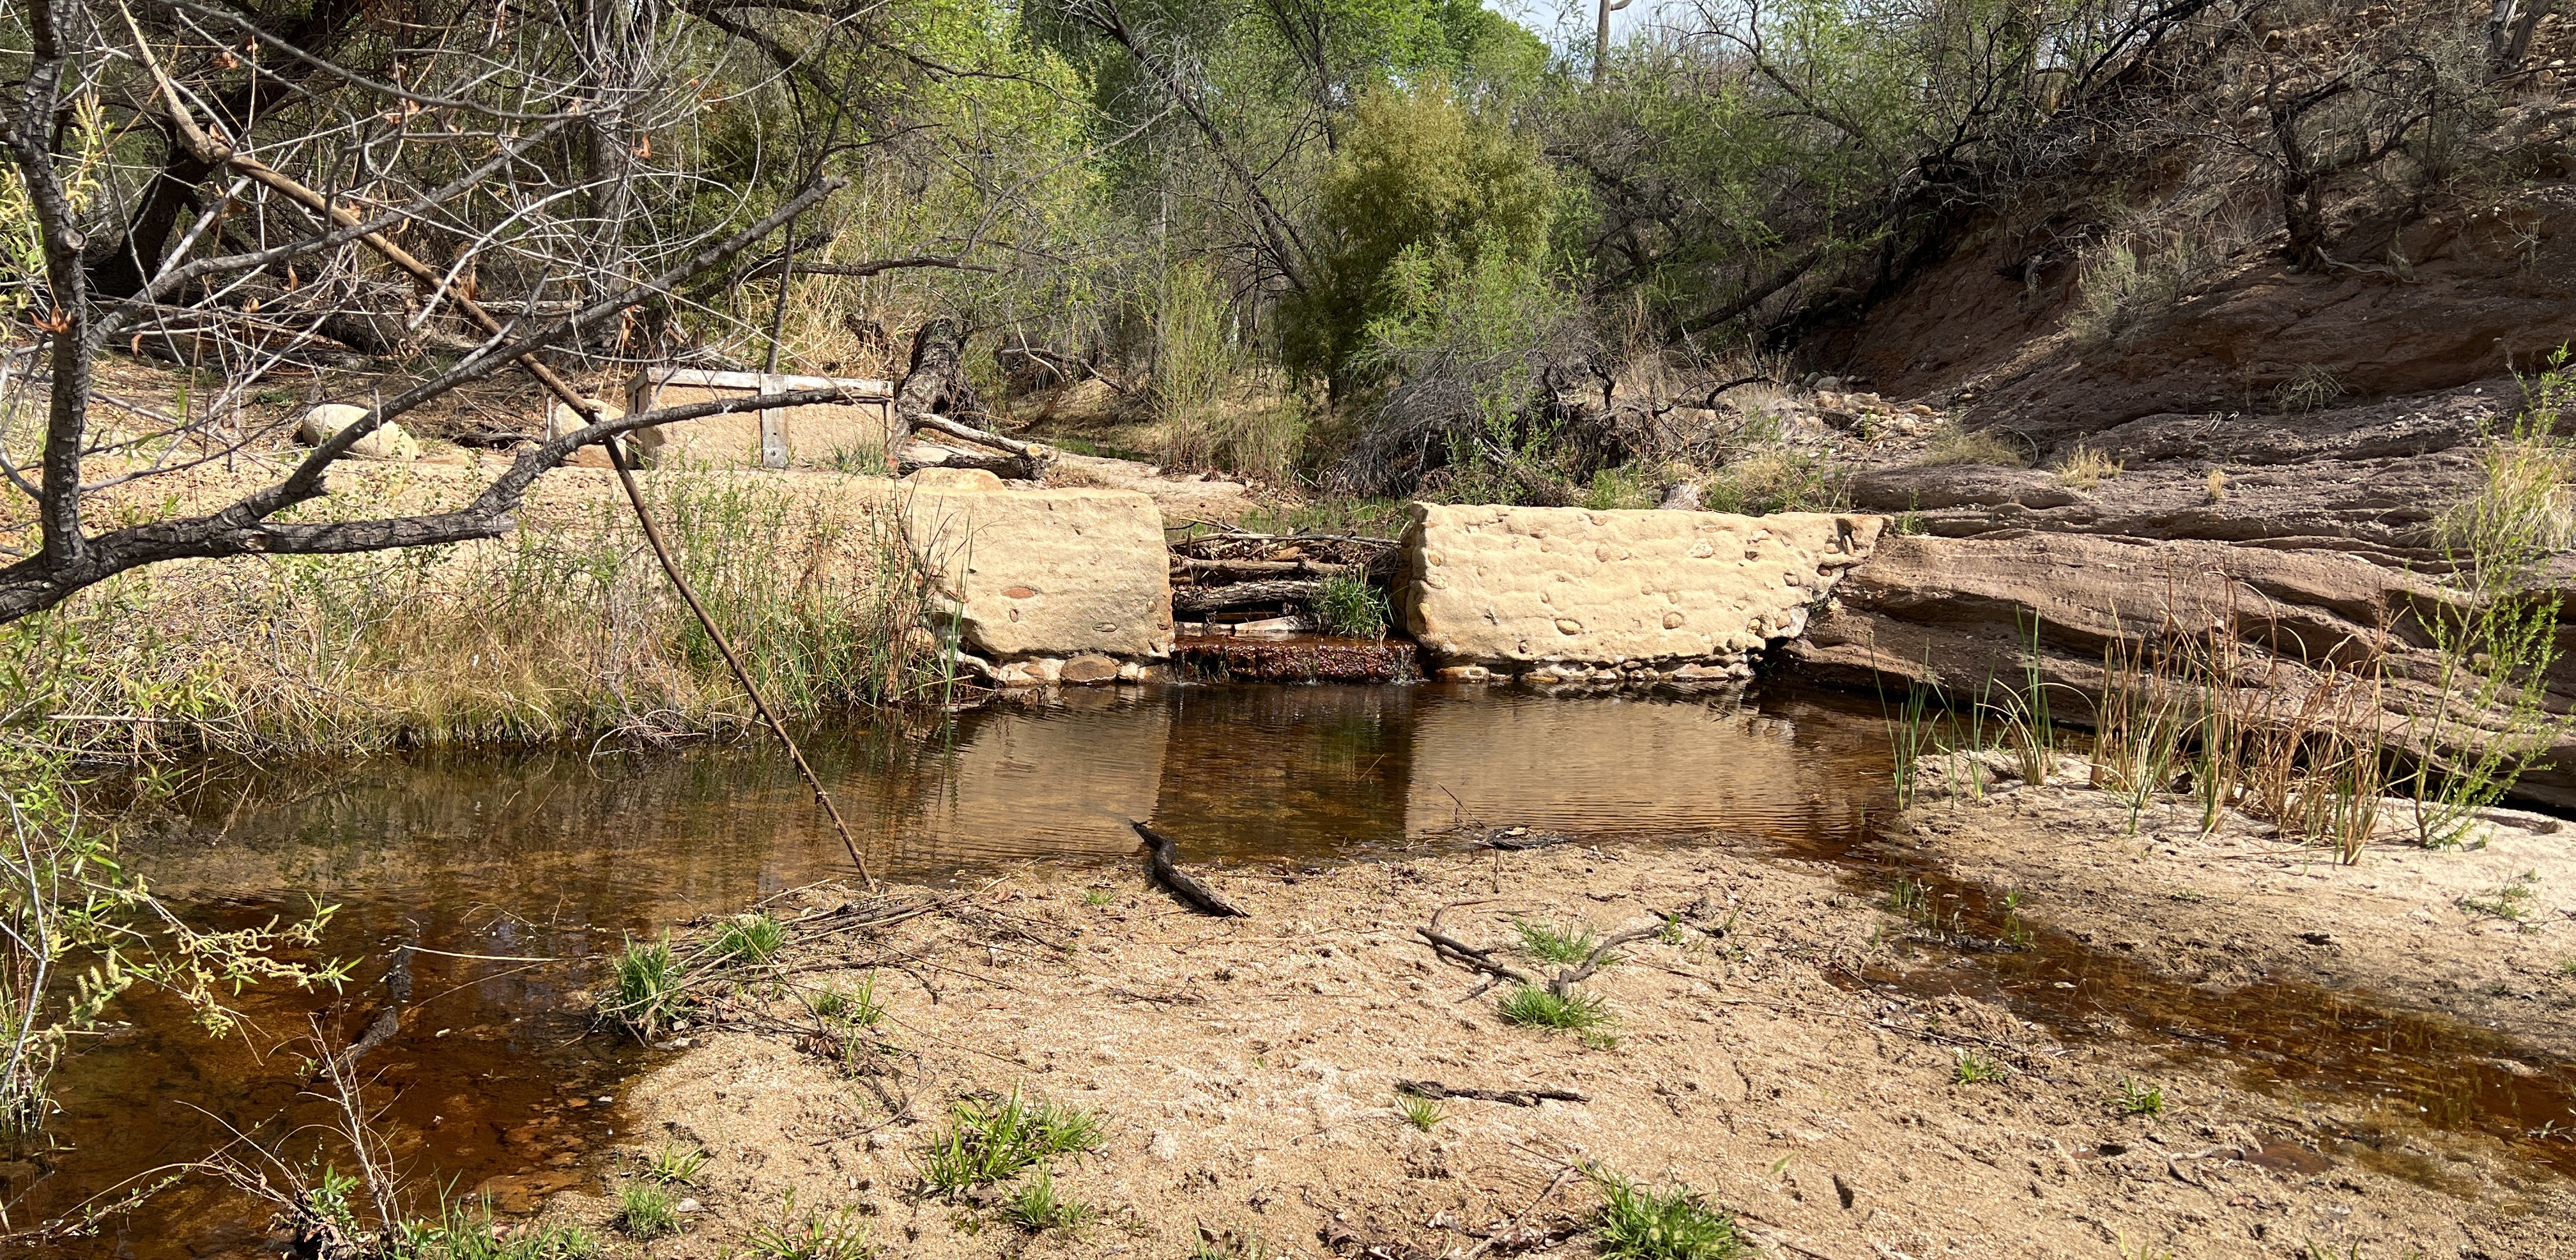
Sabino Creek at Wes Miller Park
Flow365 Monitors: Wendy Beall
2025 Water Year: 365 Days
2024 Water Year: 365 Days
2023 Water Year Flow: 365 Days
2016 - 2022 Water Years Flow: 365 Days
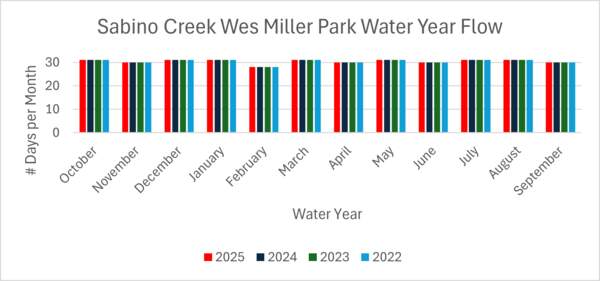
Sabino Creek Wes Miller Park 2025 Water Year Flow
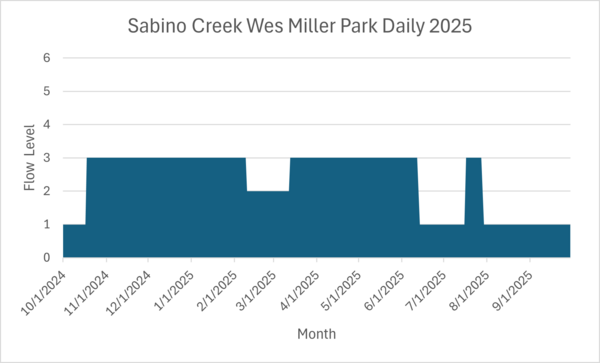
Daily estimated flow levels during the 2025 Water Year along Sabino Creek at Wes Miller Park
Most of Lower Sabino Creek is privately owned by residential landowners. We have captured data since the start of our program with permission from the surrounding private landowners and the homeowners’ association that uses and preserves this area. The restored perennial flow that we observed from 2016 to 2022 is likely the result of a reduction in groundwater pumping at several nearby groundwater wells.
For areas like this, where we see consistent surface flow year round, the water year graphs look the same over time due to consistent water presence each year. However, daily flow levels fluctuate based on season, rainfall, snowmelt, and many other factors. The second graph, labeled “Sabino Creek Wes Miller Park Daily Flow 2025,” tells us the story of flow levels for this water year, with values ranging from one (standing water but no water movement) to 3 (low flow or shallow moving water). Sites like these need rainfall and snowmelt input into the aquifer to ensure a consistent connection to the surface, and since this year was highly affected by lack of both rain and snow, we see a decline in flow in early July to 1, or ponded water. There was still groundwater connection to the area, but not enough recharge to keep the flow moving at a higher level on the scale by the later months in the water year, nor enough to combat the heat and water needs of the plants in the riparian area.
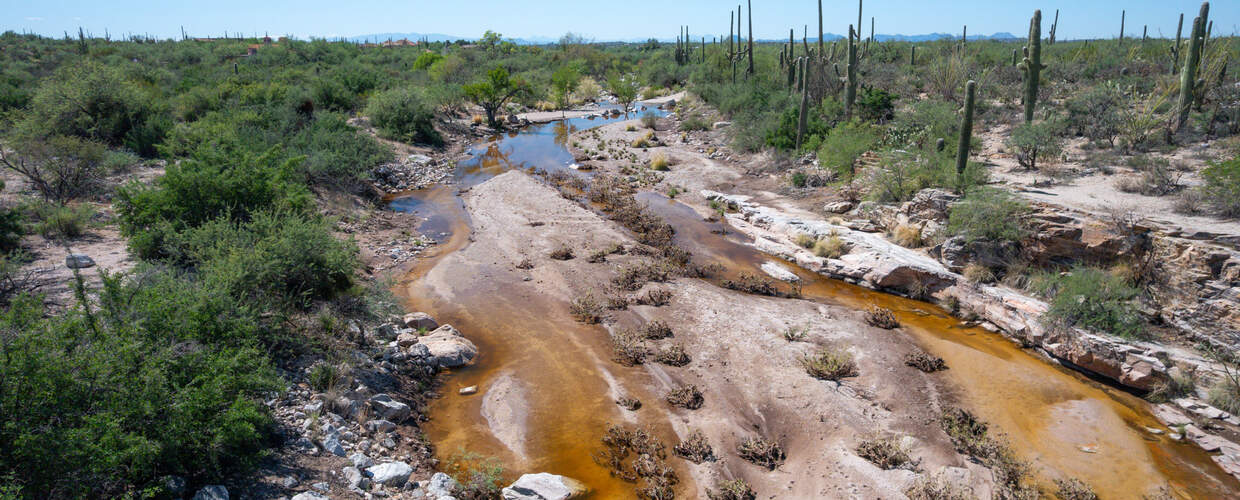
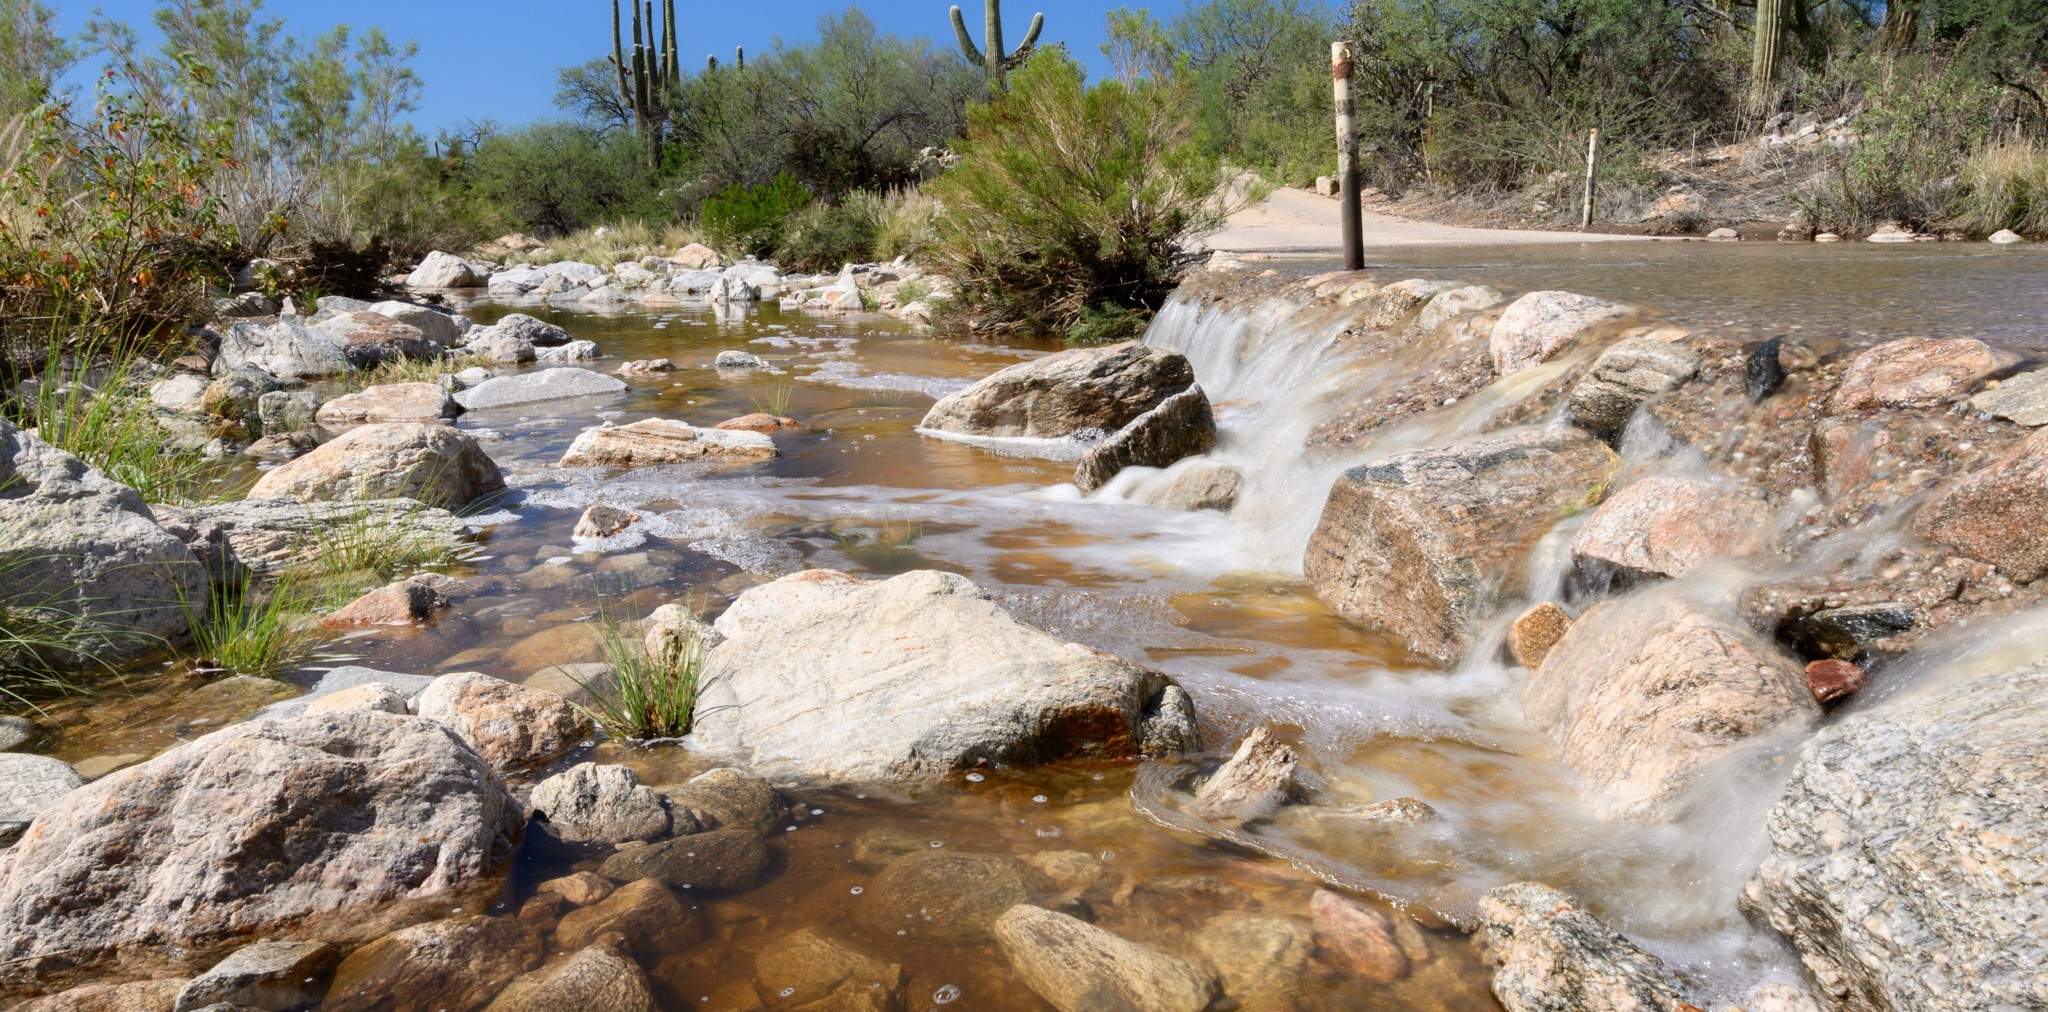
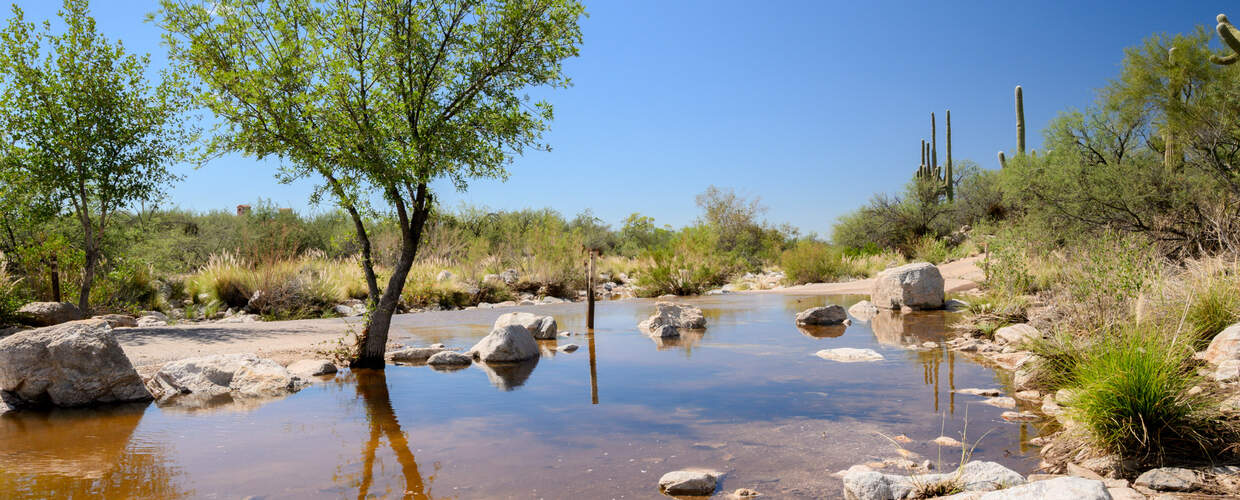
Agua Caliente Creek
North of Tanque Verde Creek, at the foot of the Catalina Mountains, Agua Caliente Creek runs just west of Agua Caliente Park and eventually meets up with Tanque Verde Creek. Our Flow365 monitors have revealed that flow in this area is dependent on rain and snowmelt. Though the Tanque Verde does not flow year-round in this area, data shows short intermittent flows throughout our winter season sustained by mountain snowmelt runoff. The creek is able to meander freely in much of its floodplain and has more natural flow, unlike some of the channelized rivers (e.g., the Santa Cruz) in the metro area.
Agua Caliente Creek at Milagrosa Lane
Flow365 Monitors: Bethany DeRango, Andrea Martin
2025 Water Year Flow: 2 Days
Most consecutive flow (2025): 0 Days
2024 Water Year Flow: 82 Days
Most consecutive flow (2024): 75 Days
2023 Water Year Flow: 100 Days
Most consecutive flow (2023): 100 Days
2022 Water Year Flow: 82 Days
Most consecutive flow (2022): 46 Days
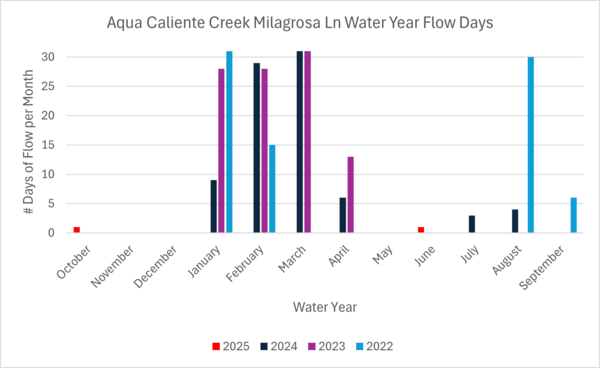
Many of our creeks and rivers were severely affected by the drought in the 2025 water year. Agua Caliente Creek was no exception. We can see by comparing water years in the graph that the lack of rain had a huge effect on this section of our river system. In the 2024 water year, for instance, water flowed for 82 days, 17% of the water year, whereas the 2025 water year had only 2 days of flow, less than 1% of the water year.
We had assumed that this site would flow intermittently, with flows lasting a bit longer on the surface after a rainfall event due to a shallow groundwater connection. Given the fact that the drought highly affected the water flow this year, however, this area may also be ephemeral based on data collected this year. We will need more information to truly understand the category this site should fit in.
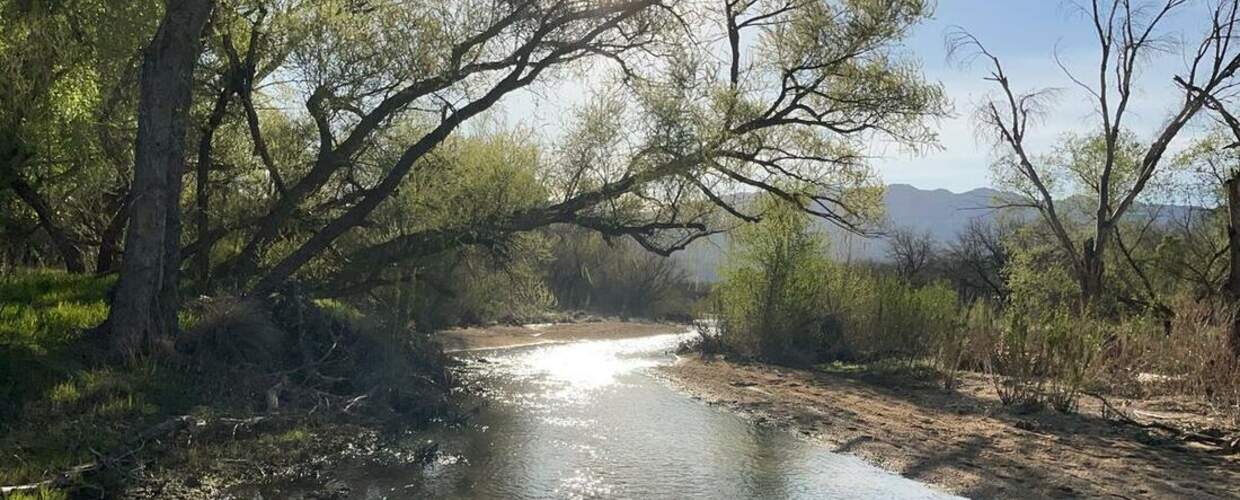
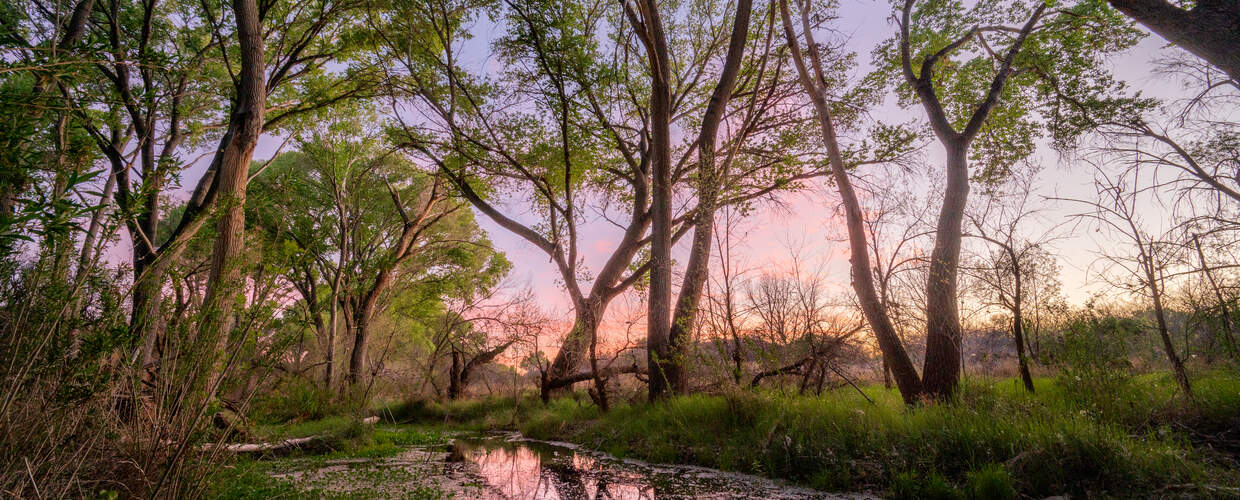
Tanque Verde Creek
Historically, stretches of the Tanque Verde Creek often flowed either seasonally or year-round, with marshy ciénegas sustained by beaver. But since the mid-1900s, this creek has been drying up with the loss of seasonal and year-round flows due to depleted groundwater levels from over-pumping of groundwater.
The Wentworth Bosque is one of the few remaining riparian forests with floodplain connection (e.g. without concrete-lined banks) in the Tucson basin. Species in this bosque include Fremont cottonwood, Goodding's willow, Mexican elderberry, and velvet mesquite, as well as many other riparian plants native to the Sonoran Desert. Unfortunately, it has more recently become home to an invasive species called Arundo donax, a giant cane reed. This highly flammable reed crowds out native plants and uses up to 3-4 times the amount of water as native plants, diminishing flow. Through the River Run Network, volunteers and staff are working to remove this species along the Tanque Verde Creek. To date, we have removed invasive Arundo from over 60 acres of the creek.
Learn more about our Arundo removal efforts and how to get involved here.
Tanque Verde Creek at Wentworth Bosque
Flow365 Monitors: Jim Washburne, Mary Caldwell, Lauren Knight
2025 Water Year Flow: 7 Days
2024 Water Year Flow: 241 Days
2023 Water Year Flow: 239 Days
2022 Water Year Flow Days: 276 Days
2021 Water Year Flow: 65 Days
Most consecutive flow days: 288 days, July 23, 2021 – May 6th, 2022
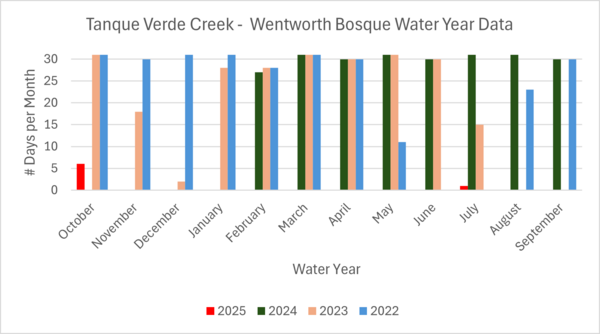
WMG has observed seasonal flows in the Tanque Verde at Wentworth Bosque since 2019. Between the 2021 and 2022 water years, our Flow365 monitors recorded 288 days of consecutive flow (July 23, 2021 - May 6th, 2022), a record number that still has not been beaten. This middle stretch of the Tanque Verde Creek tells an amazing story of resilience and the potential for humans’ impact on restoring flow and shallow groundwater areas. The nearby golf course that was pumping groundwater switched to reclaimed water in 2005, and since then, the aquifer and riparian forest have steadily been recovering, with seasonal flows emerging. This groundwater recovery has occurred during a time of multi-decadal drought, with many years of below-average rainfall. The Flow365 data implies that even when rainfall is scarce, humans can make choices that benefit our groundwater supply.
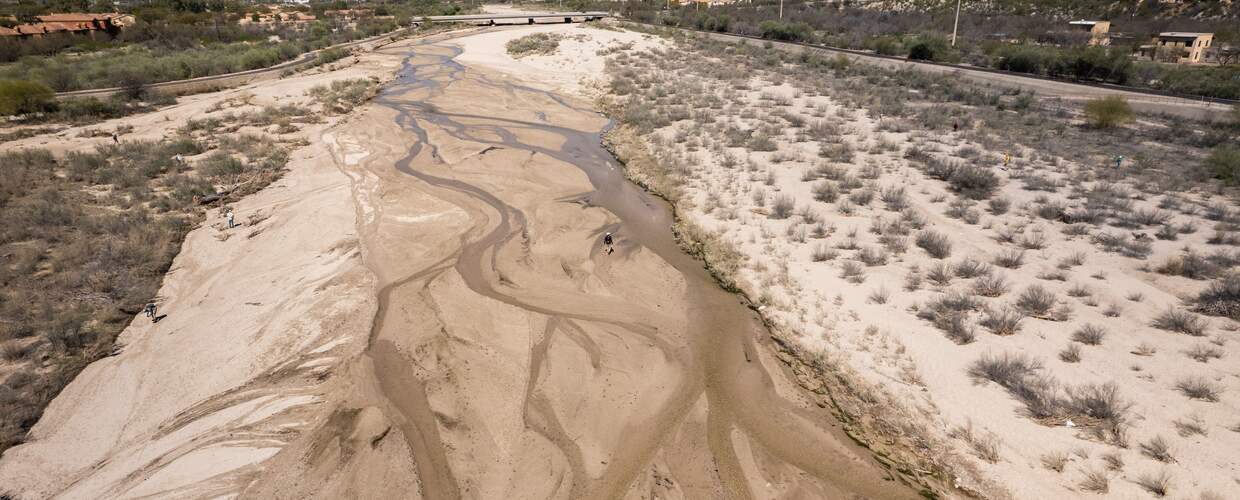
However, this water year, like at many of our other sites, surface flow in Tanque Verde Creek has declined. The only recorded flow was during the first week of October, which was the last bit of flow resulting from the previous water year’s monsoon season, and one day of recorded flow in July due to rainfall before receding back into the ground. All in all, less than 2% of the water year had surface flow.
Like Rincon Creek, the Tanque Verde Creek is a groundwater-fed system, and it only receives flow from the Rincon Mountains. If there is not enough recharge in the aquifer below the surface from rainfall and snowmelt, as was the case this water year, the water will not flow above ground. But, water is still present underground, as evidenced by the cottonwoods, willows, seep willows, and other riparian plants that could not survive without shallow subsurface flows. Given the presence of these species, we believe water here to be within 10 feet of the surface.
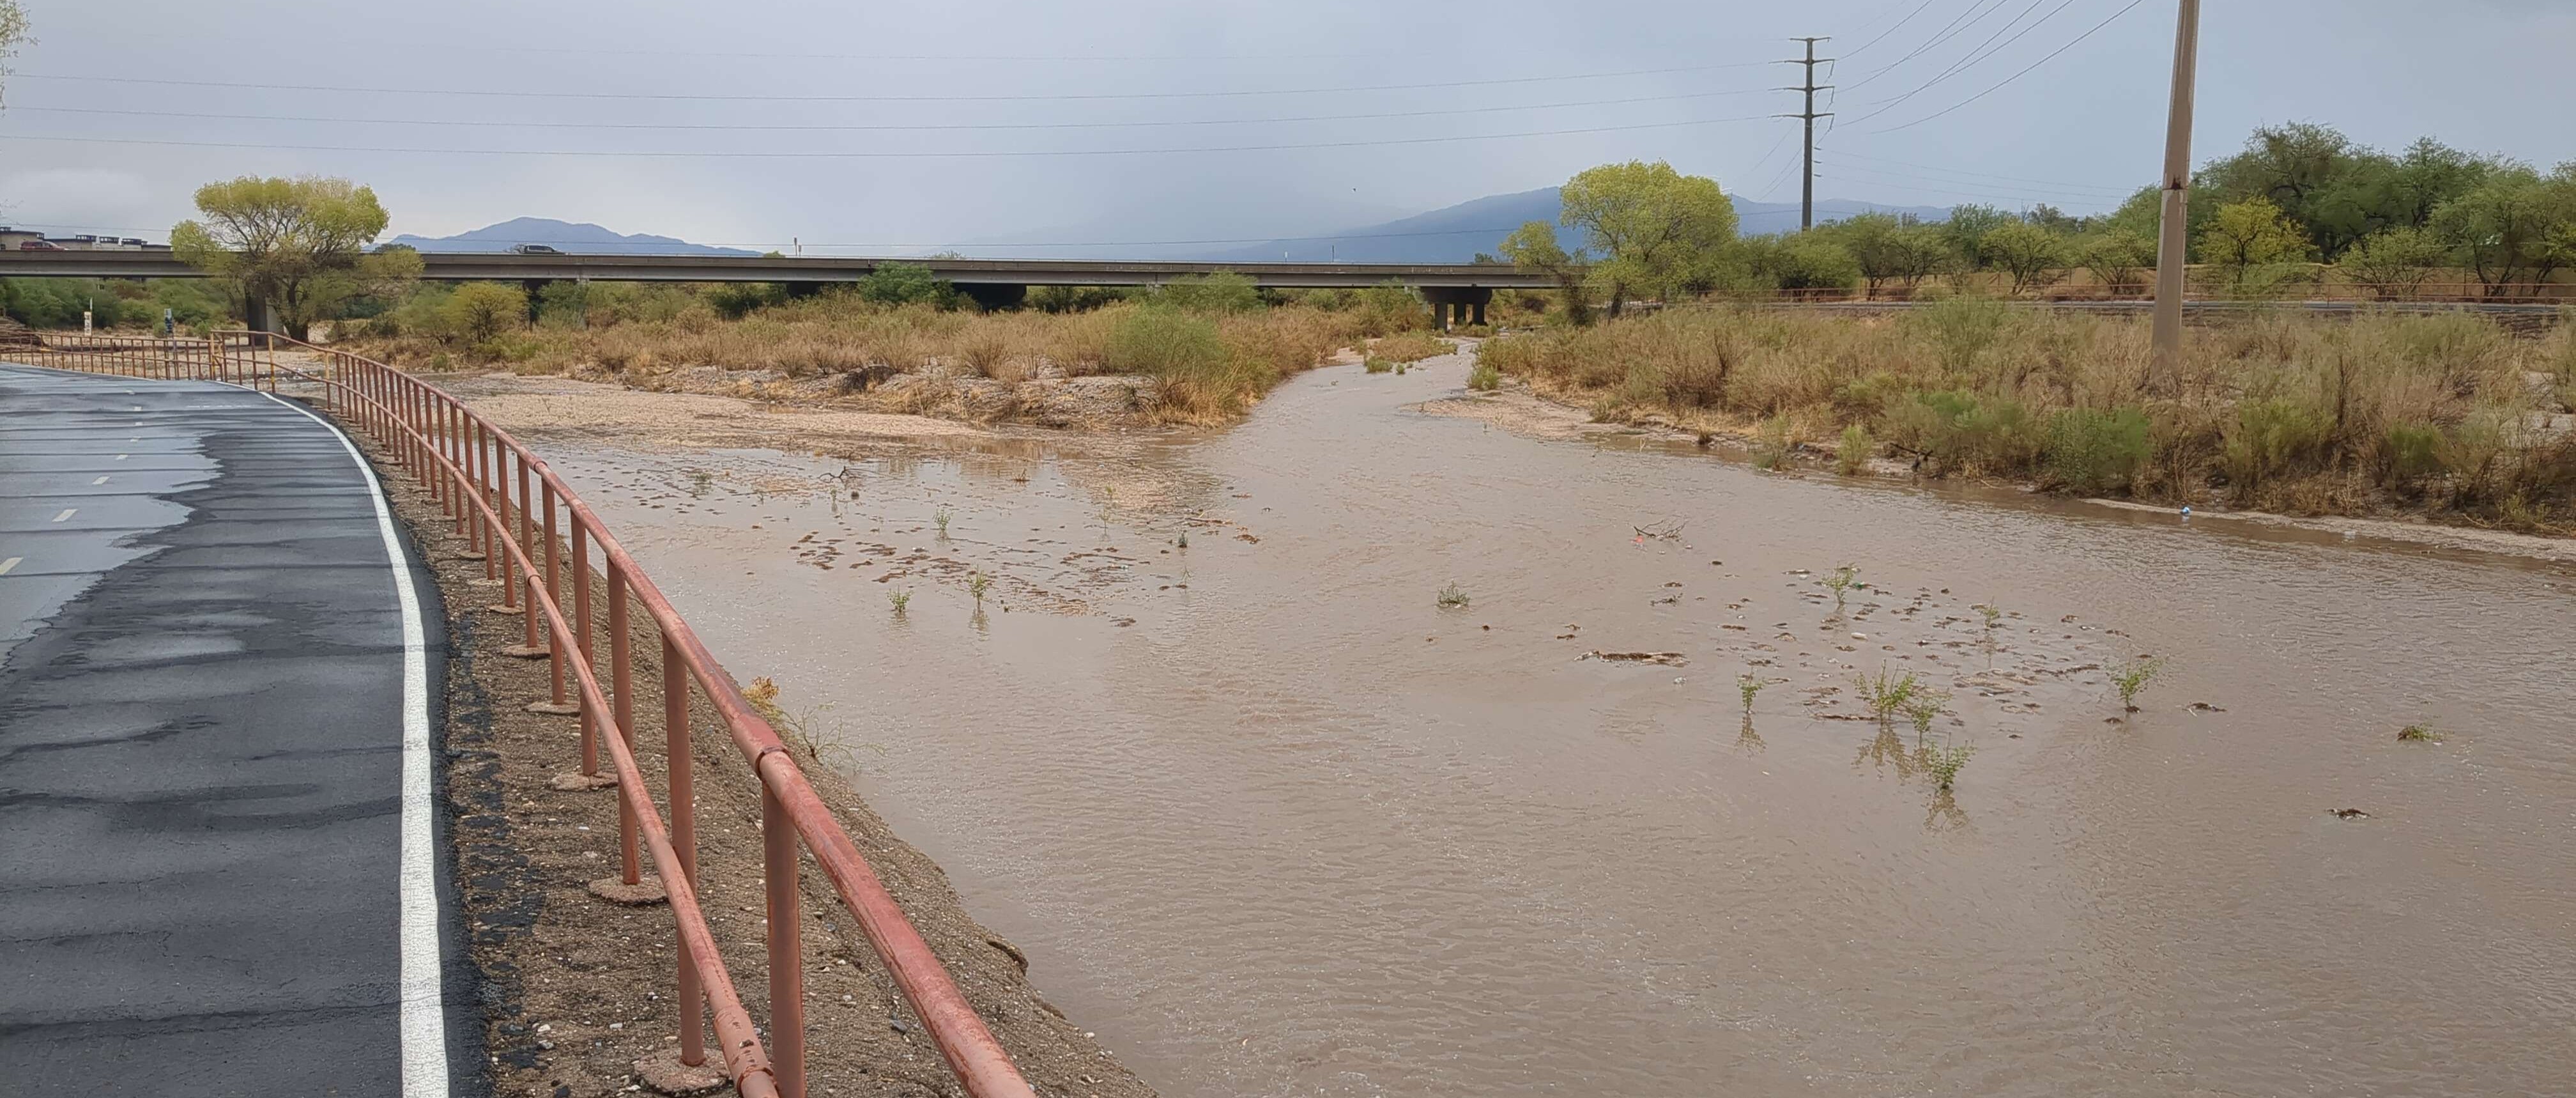
Rillito River
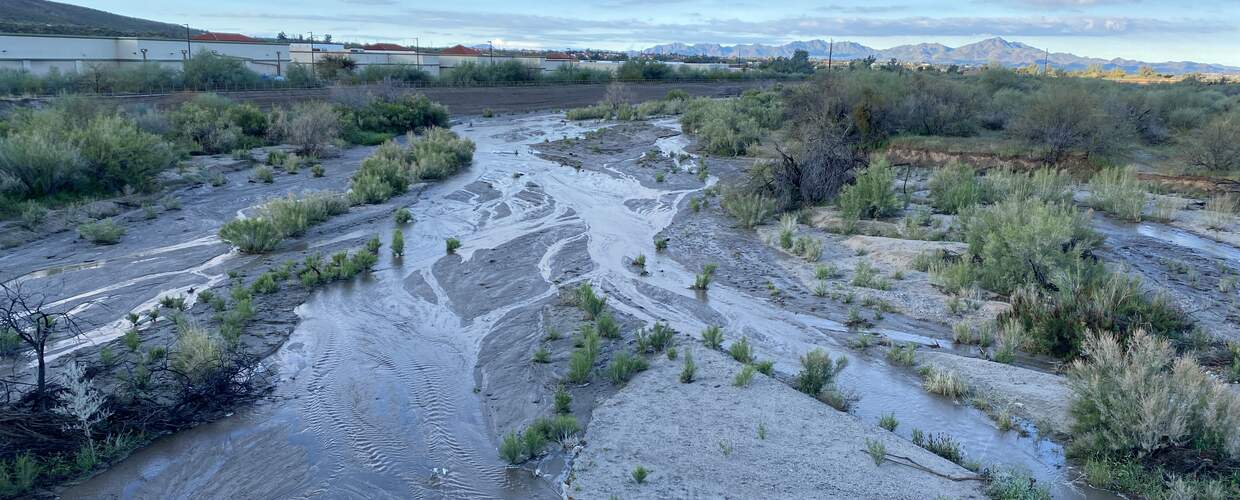
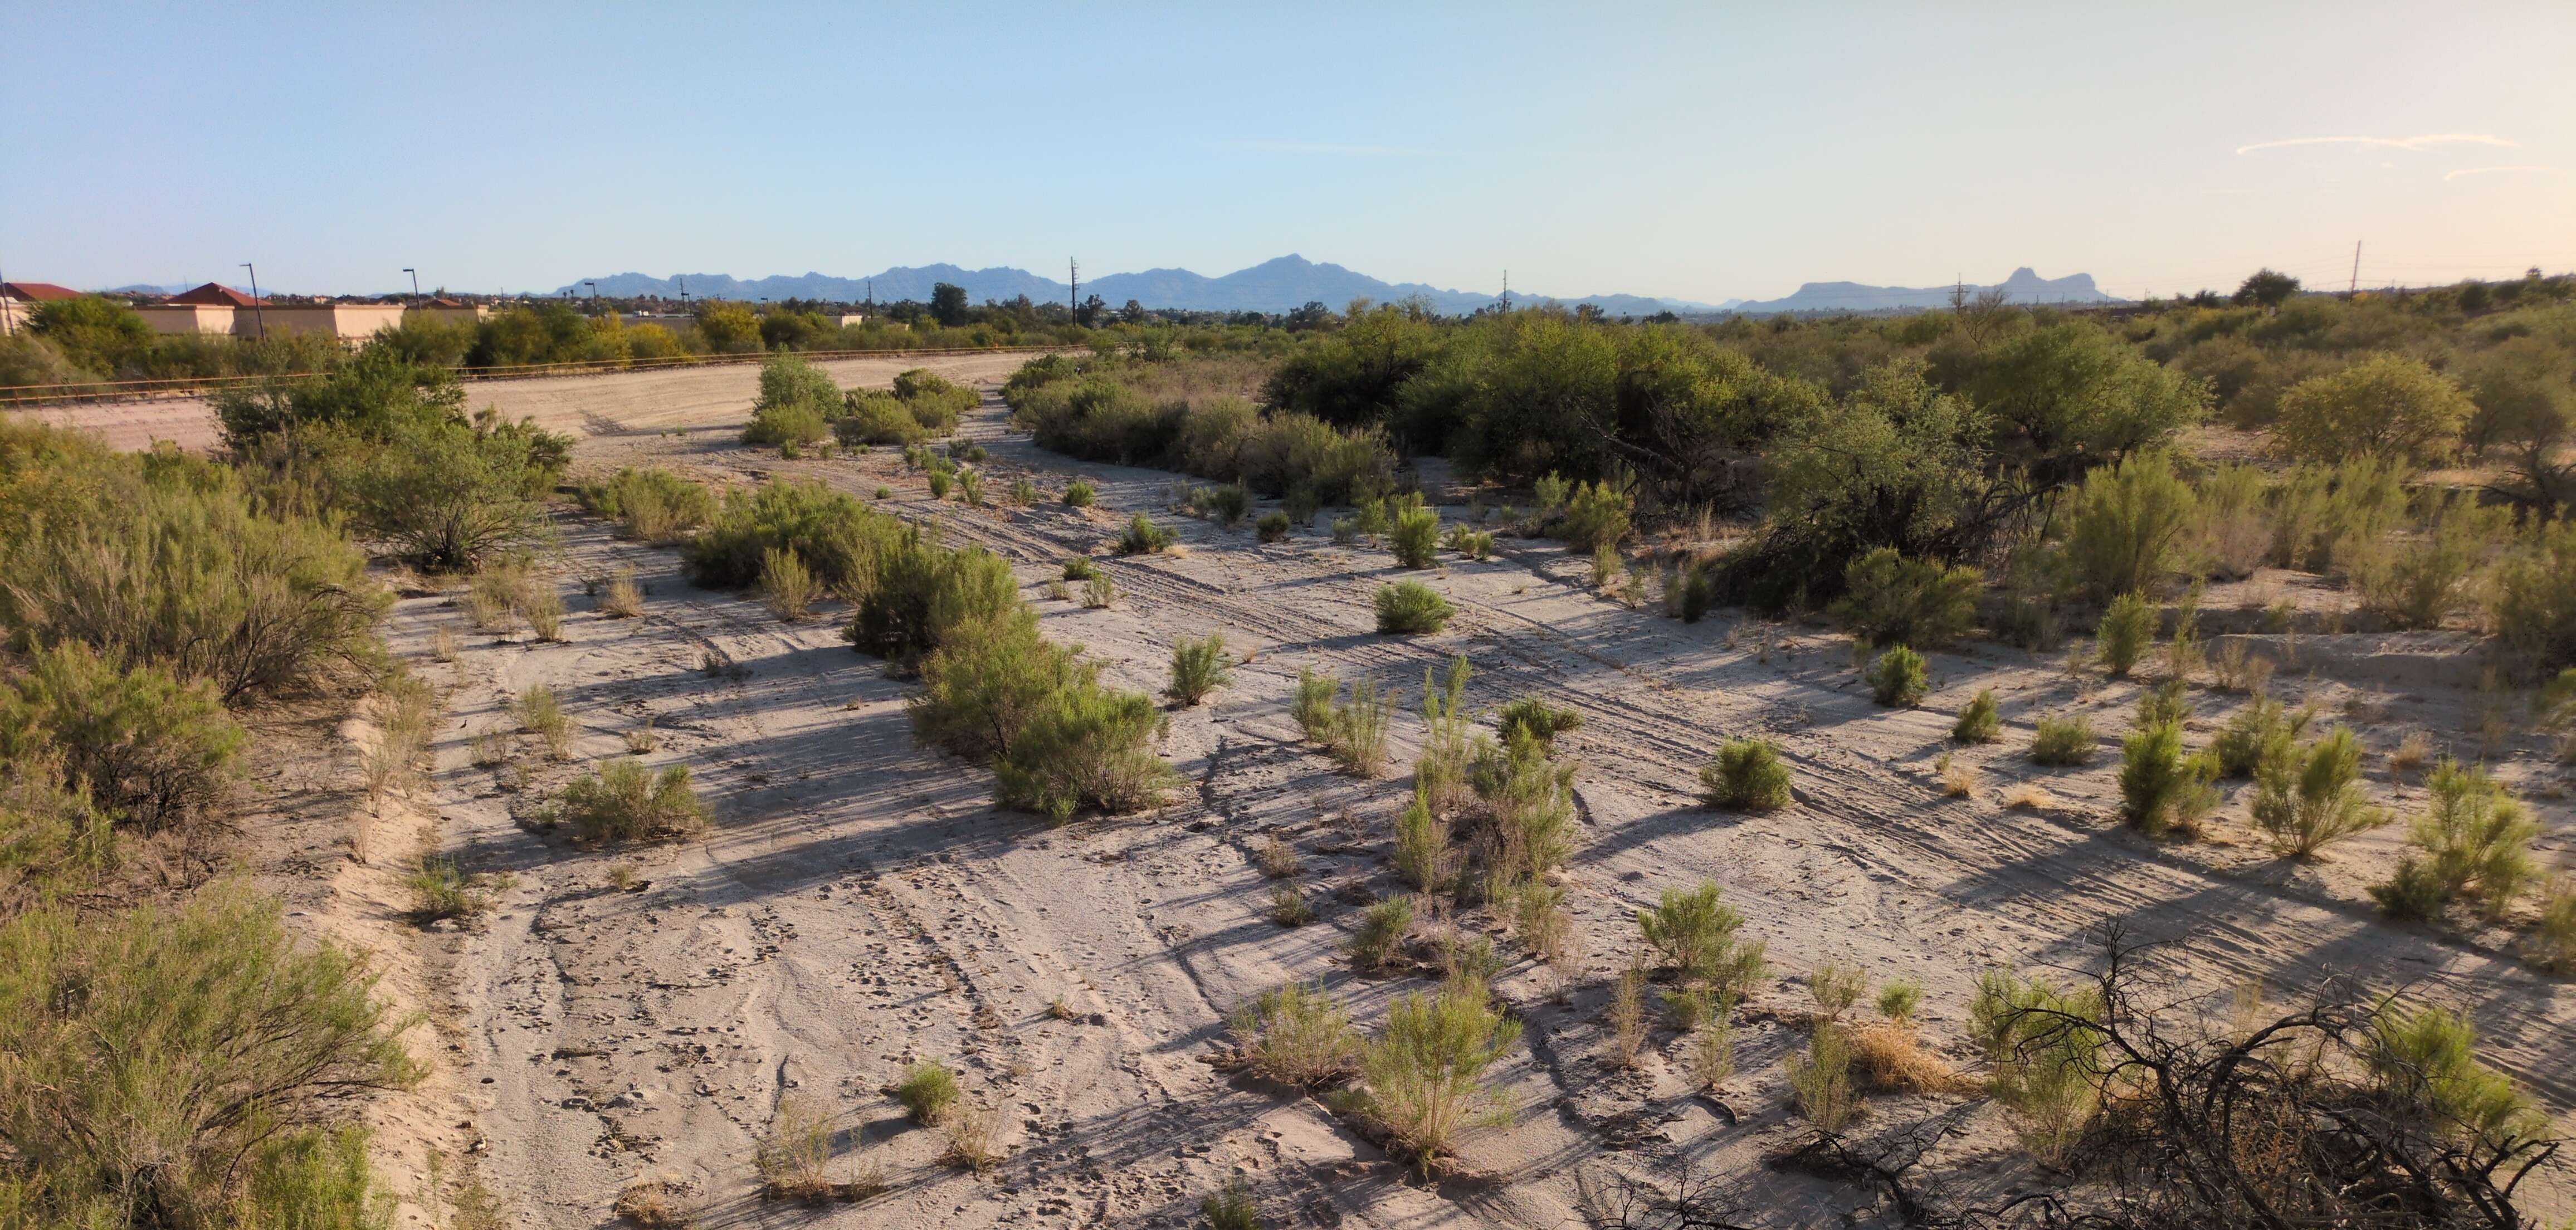
Because of The Loop path and many parks along its banks, the Rillito River is popular with the Tucson community as a corridor to walk, run, bike, and picnic. The Rillito River is fed by the Tanque Verde and Pantano Creeks, flowing from east to west and eventually connecting with the Santa Cruz River. Several Rillito River bridge crossings are also known for a large bat population, the Mexican free-tailed bats, which live in large colonies under several bridges that cross the river.
Rillito at Craycroft Road
Flow365 Monitors: Catlow Shipek, Susan Swartz, Oliver Wilson, Ken Lubinski, Paul Hammond, Heather McClaren, Kimberly Simpson
2025 Water Year Flow: 11 Days
Most Consecutive Flow (2025): 8 Days
2024 Water Year Flow: 76 Days
Most Consecutive Flow (2024): 25 Days
2023 Water Year Flow: 113 Days
Most Consecutive Flow (2023): 107 Days
2022 Water Year Flow: 62 Days
Most Consecutive Flow (2022): 27 Days
2021 Water Year Flow: 85 Days
Most Consecutive Flow (2021): 56 Days
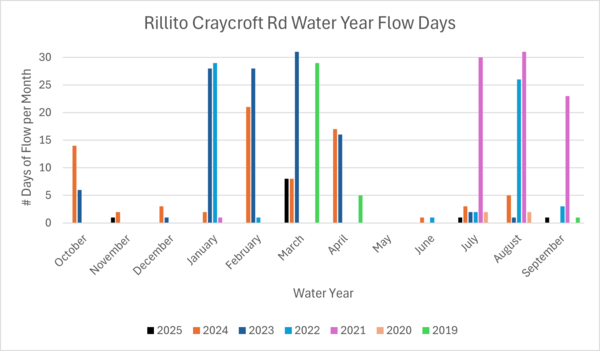
At the confluence of the Tanque Verde Creek and Pantano Creek, this monitoring site on the Rillito is considered a shallow groundwater area, with water within 30 to 50 feet of the surface. The shallow groundwater still supports some cottonwood trees from a historically much larger cottonwood forest, as well as a Mexican elderberry grove and a rheocrene, or in-stream, spring upstream of the confluence in the Tanque Verde Creek. Historically, this area had year-round flow through a large ciénega (marsh) with a large mesquite bosque (forest) that supported Indigenous communities.
Presently, it is a shallow groundwater system that is impacted by local groundwater pumping, which reduces the groundwater connection to support surface flows and riparian forests. From last water year’s 76 days of flow down to 11 days this year, the area had surface flow for only 3% of the water year. However, the continued presence of cottonwoods in this area indicates that the groundwater levels persist. You can see the largest cottonwood near the bridge in most of the photos from monitors throughout the year.
Cañada del Oro River
The Cañada del Oro River originates in a remote portion of the Catalina Mountains north of Tucson. Fed by rainfall and melted snow, it flows north toward the town of Oracle and then turns south toward Oro Valley, where it is usually seen as a dry riverbed. The Cañada del Oro ultimately feeds into the Santa Cruz River just northwest of the city.
Historically, the Cañada del Oro River was largely intermittent and ephemeral, meaning that even without groundwater pumping and floodplain channelization, it only had above-ground flow during rainy seasons. However, there are reports that some areas in the upper parts of the river were plentiful with water close to the surface, like at the Steam Pump Ranch in Oro Valley. Now, the Cañada del Oro River is consistently ephemeral, not seeing flow unless there is rainfall, and little even then.
Cañada Del Oro River at 1st Avenue
Flow365 Monitors: Angela Greynolds, Kelly Windsor, Johanna Stansfield, Julie Ray, Michael Smejkal, Thomas Fresneau
2025 Water Year Flows: 0 Days
2024 Water Year Flow: 3 Days
2023 Water Year Flow: 7 Days
2022 Water Year Flow: 16 Days
2021 Water Year Flow: 12 Days
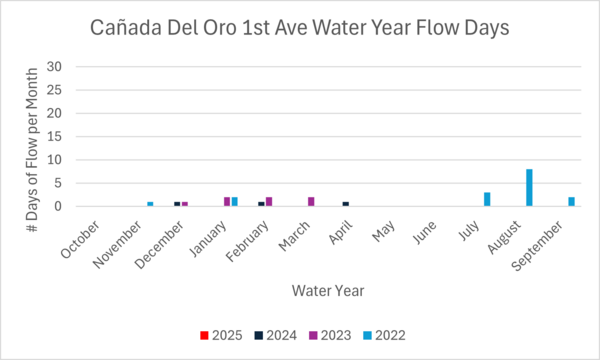
2025 was another considerably dry water year for the Cañada Del Oro, with no days of flow recorded. Though this area is extremely dry, with water hundreds of feet below the surface, we continue to have a robust data set for this site in particular, receiving data on average once a week and sometimes more frequently. Given the low to absent flows recorded in recent years, we consider this area ephemeral, only flowing after rainfall, and rarely even then.
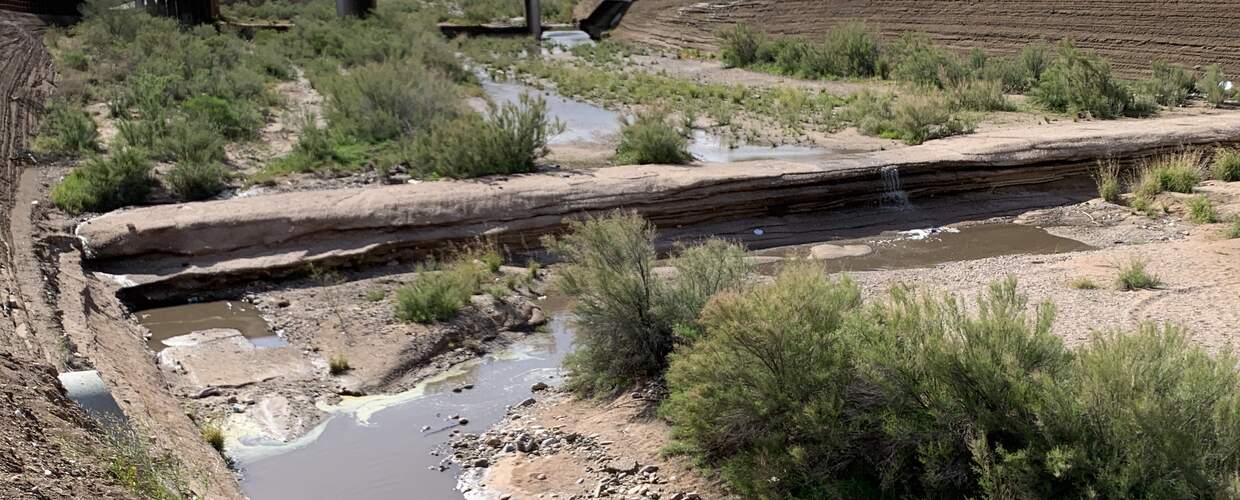
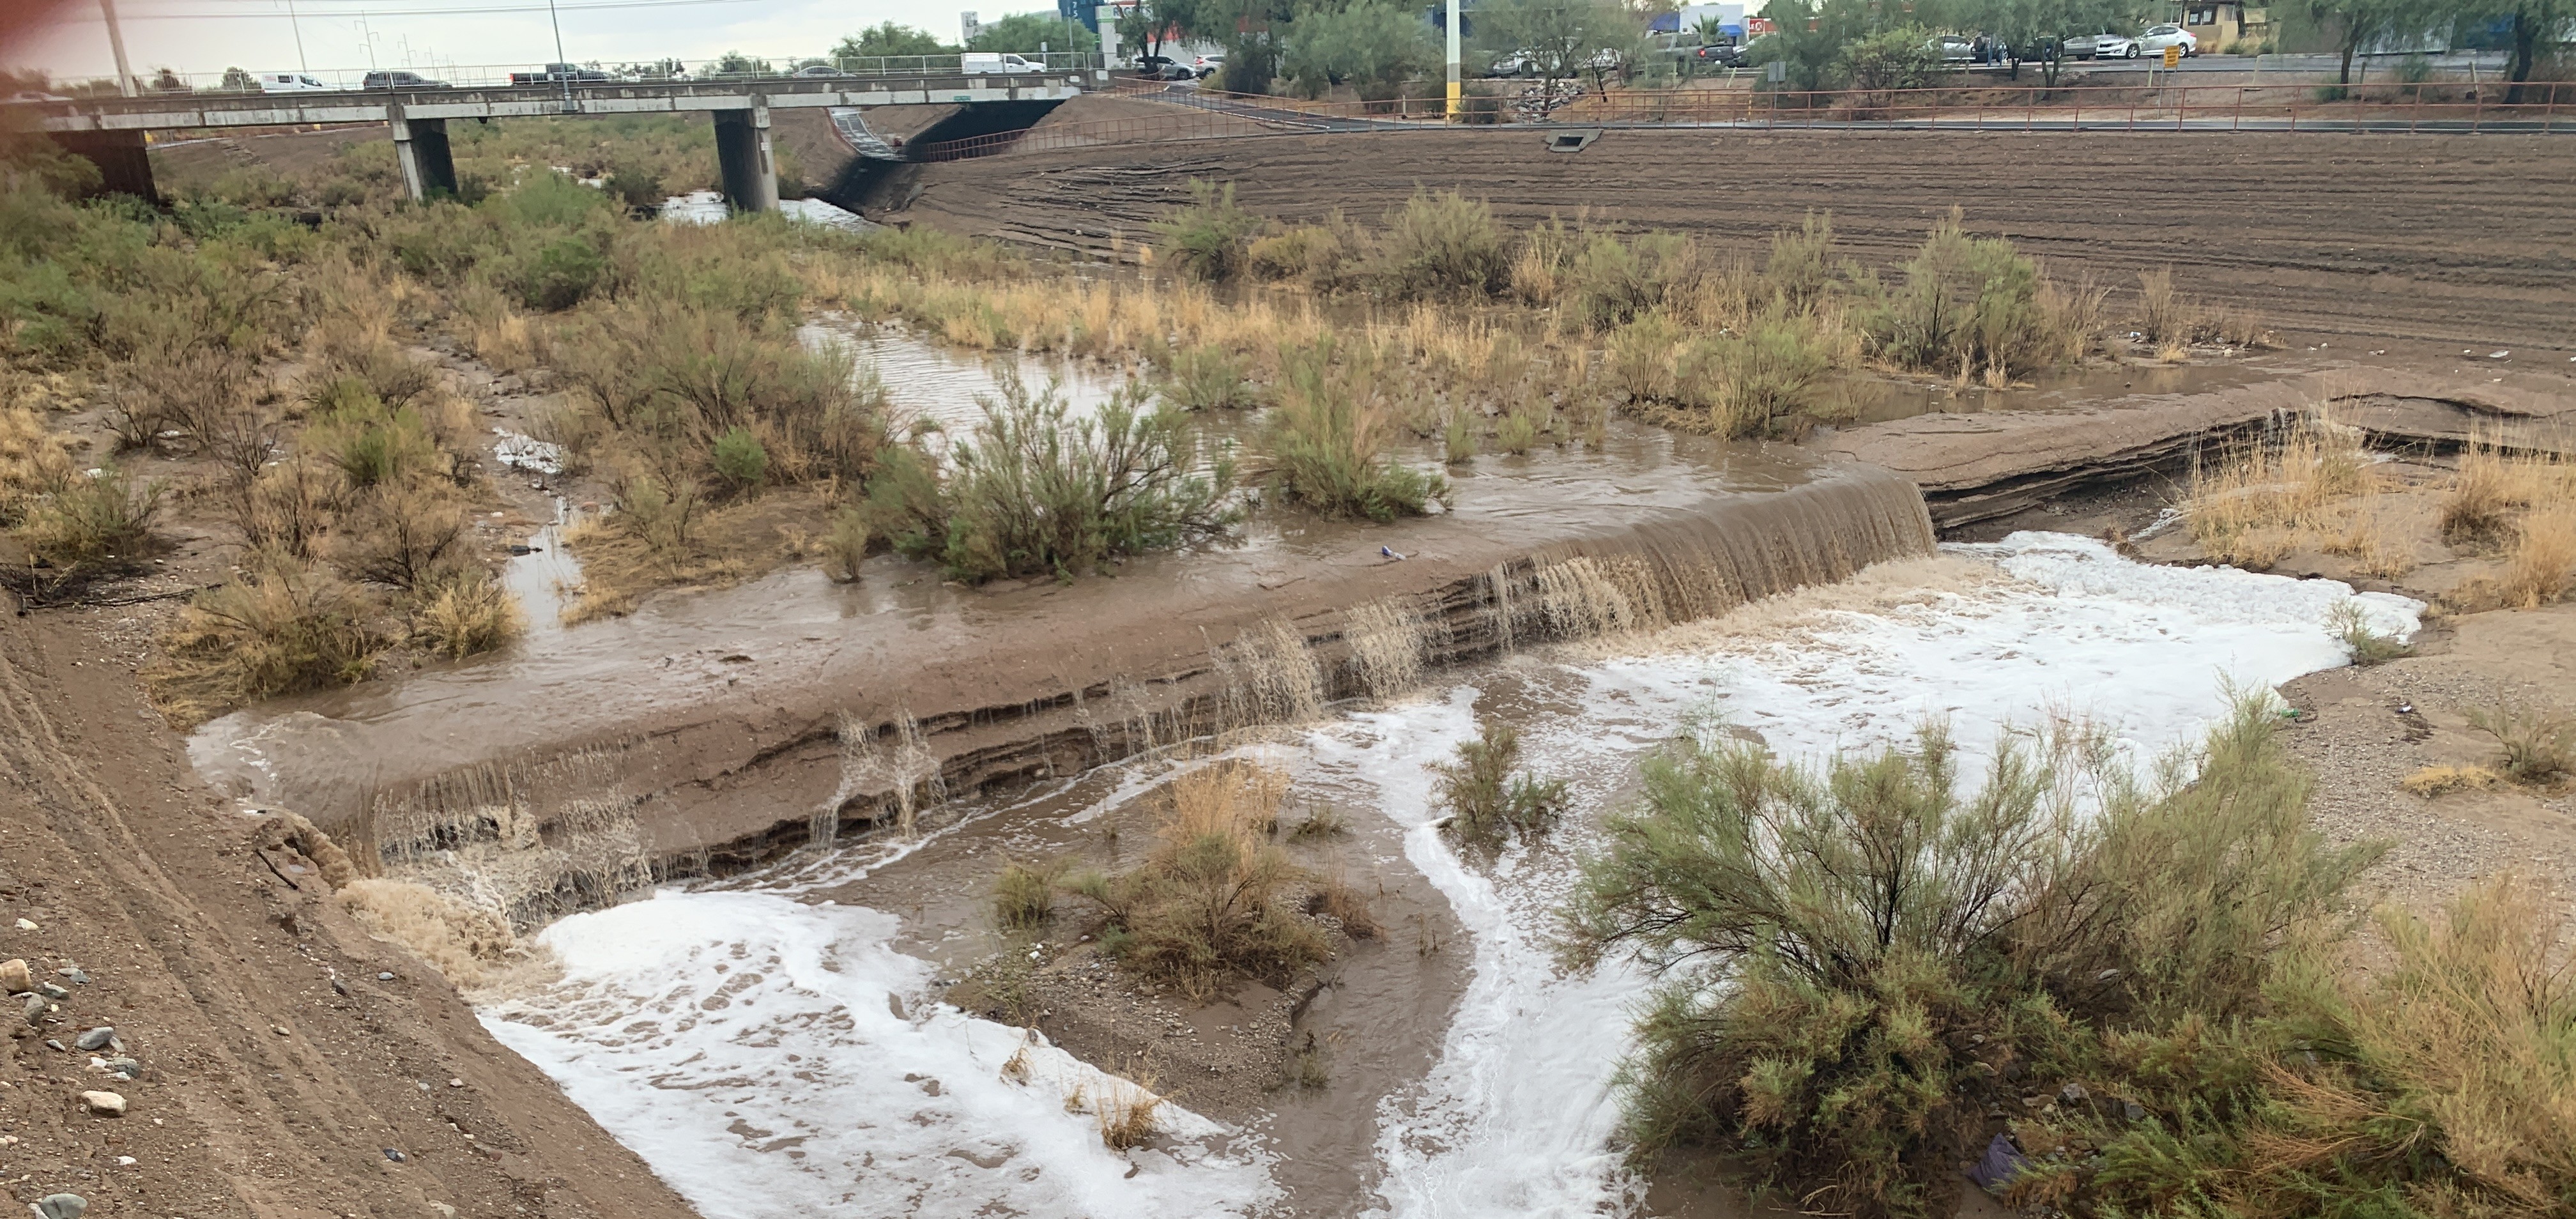
Pantano Creek
Pantano Creek originates at the confluence of Ciénega Creek and Agua Verde Creek, southeast of Tucson near Vail. Flow primarily comes from Ciénega Creek and secondarily from Rincon Creek, which originates east of Tucson near Rincon Peak. Pantano Creek flows north to join Tanque Verde Creek at Craycroft Road, becoming the Rillito River.
Although it is fed by two creeks with seasonal and perennial flow stretches, the Pantano rarely flows as the water quickly sinks into the deeper aquifer. Although there is not much flow observed within this creek, and despite the fact that it is largely disconnected from its historic floodplain due to concrete bank stabilization, the creek has a beautiful meandering pattern when it does flow, emulating the natural course of a desert river.
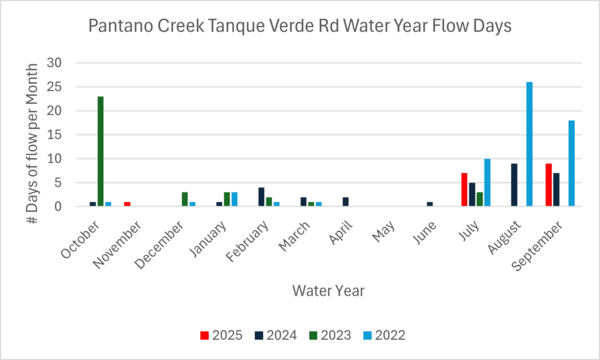
Pantano Creek at Tanque Verde Road
Flow365 Monitors: Carol Bauer, Susan Syracuse, Matt Gorski
2025 Water Year Flow: 17 Days
Most consecutive flow days (2025): 5 Days
2024 Water Year Flow: 32 Days
Most consecutive flow days (2024): 16 Days
2023 Water Year Flow: 35 Days
Most consecutive flow days (2023): 13 Days
The Tanque Verde Road monitoring site is our last along the Pantano before it merges with the Tanque Verde Creek just downstream to form the Rillito. The data from this site helps shed light on the origins of the water that flows through the Rillito each year.
In past years, much of the flow into the Rillito came from the Tanque Verde Creek, especially since the Pantano Creek is fed by the southeastern part of the Rincon Mountains, almost 20 miles from this monitoring site. However, given the lack of flow observed in the Tanque Verde during the 2025 water year versus this site’s 17 days of recorded flow, much of the Rillito’s flow this water year derived from the Pantano. This shift in Rillito flow sources marks a stark change from previous years but is indicative of the lack of rainfall received this year by the Tanque Verde Streamshed.
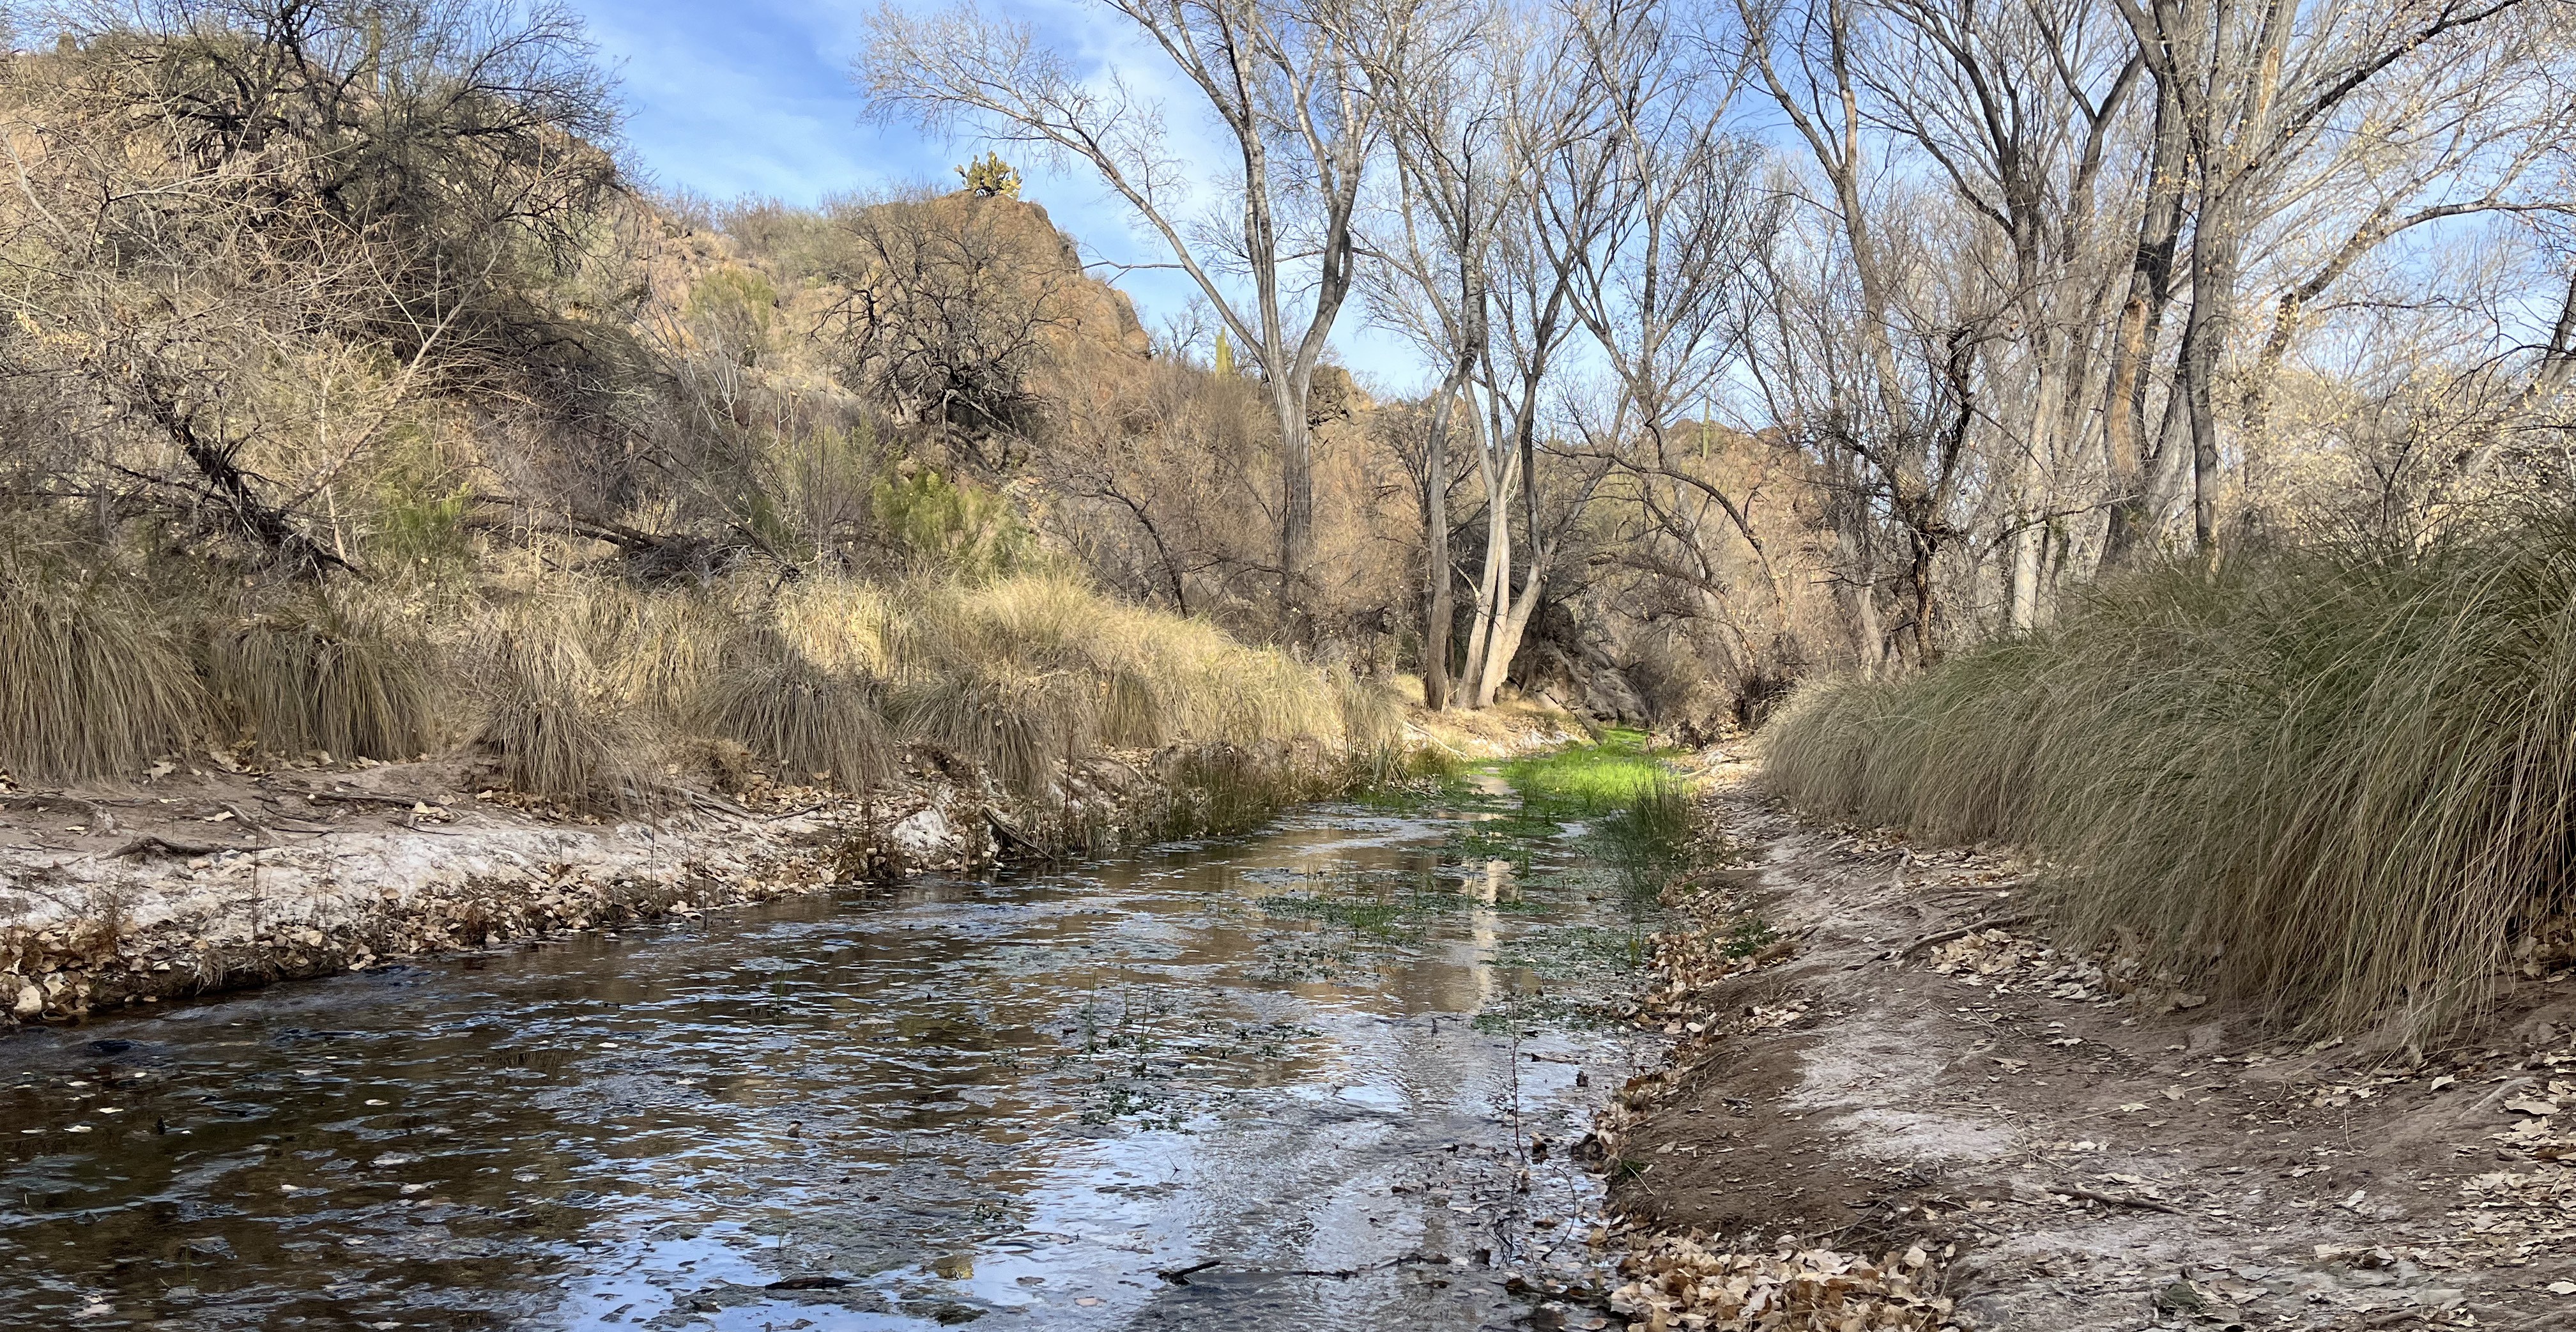
Ciénega Creek
Ciénega Creek is perennial in many stretches and extends from the eastern base of the Santa Rita Mountains to eventually connect to Pantano Creek. Watershed’s River Run Network program spends quite a bit of time in Ciénega Creek. From restoration workshops at Empire Ranch, where we are planting native riparian plants and moving rocks to slow, spread, and sink flow into the ground, to fence line surveys in the National Conservation Area in the upper reaches to support the reintroduction of beavers, we enjoy learning from and helping to enhance Ciénega Creek.
Ciénega Creek at Marsh Station Road
Flow365 Monitors: Savannah Sanchez
2025 Water Year Flow: 365 Days
2024 Water Year Flow: 365 Days
2023 Water Year Flow: 365 Days
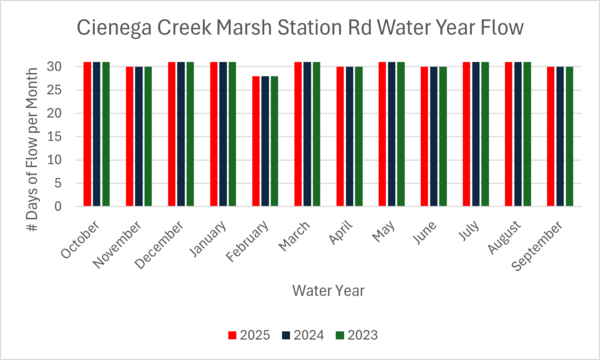
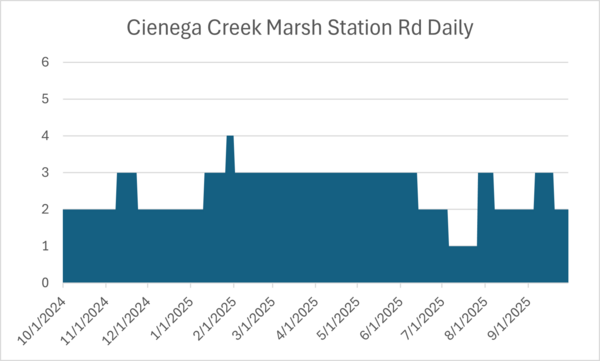
Ciénega Creek at Marsh Station Road 2025 Water Year Flow
Daily estimated flow levels during the 2025 Water Year along Ciénega Creek at Marsh Station Road.
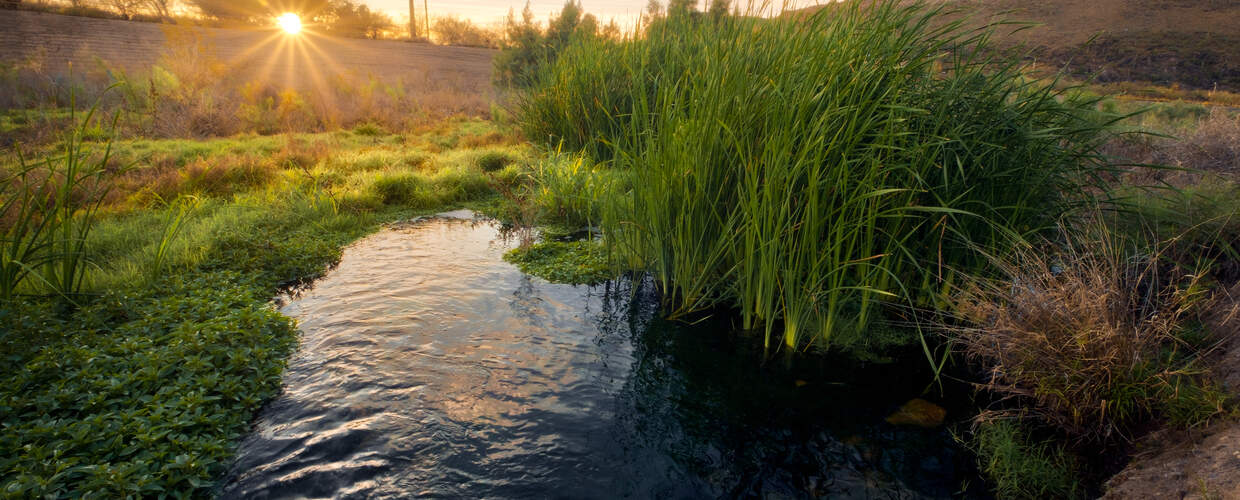
This monitoring location at Marsh Station Road requires a short hike from Gabe Zimmerman Trailhead, and the typical visit may take 40 minutes to an hour. Along the way, the flora transitions from upland desert plants like ocotillo and prickly pear cactus to riparian trees like large cottonwoods and willows down in the canyon and finally, to plants like duckweed floating in the water. This site is an incredible oasis that reveals what many of our other creeks and rivers could look like with consistent flow and groundwater connection.
For areas like Ciénega Creek, where we see consistent perennial flow due to a groundwater connection, the water year graphs look consistent from year to year, but the daily flow levels fluctuate. Even these sites with more consistent flow still need rainfall and snowmelt input to ensure persistent surface flow, which is why we see a decline in flow in early July to Level 1, or standing ponds. In July of 2025, there was still groundwater connection in the area, but a lack of summer rains resulted in continued low flows. Finally, with rain arriving near the end of the water year, flow levels returned to those indicating shallow flow, or Level 3.
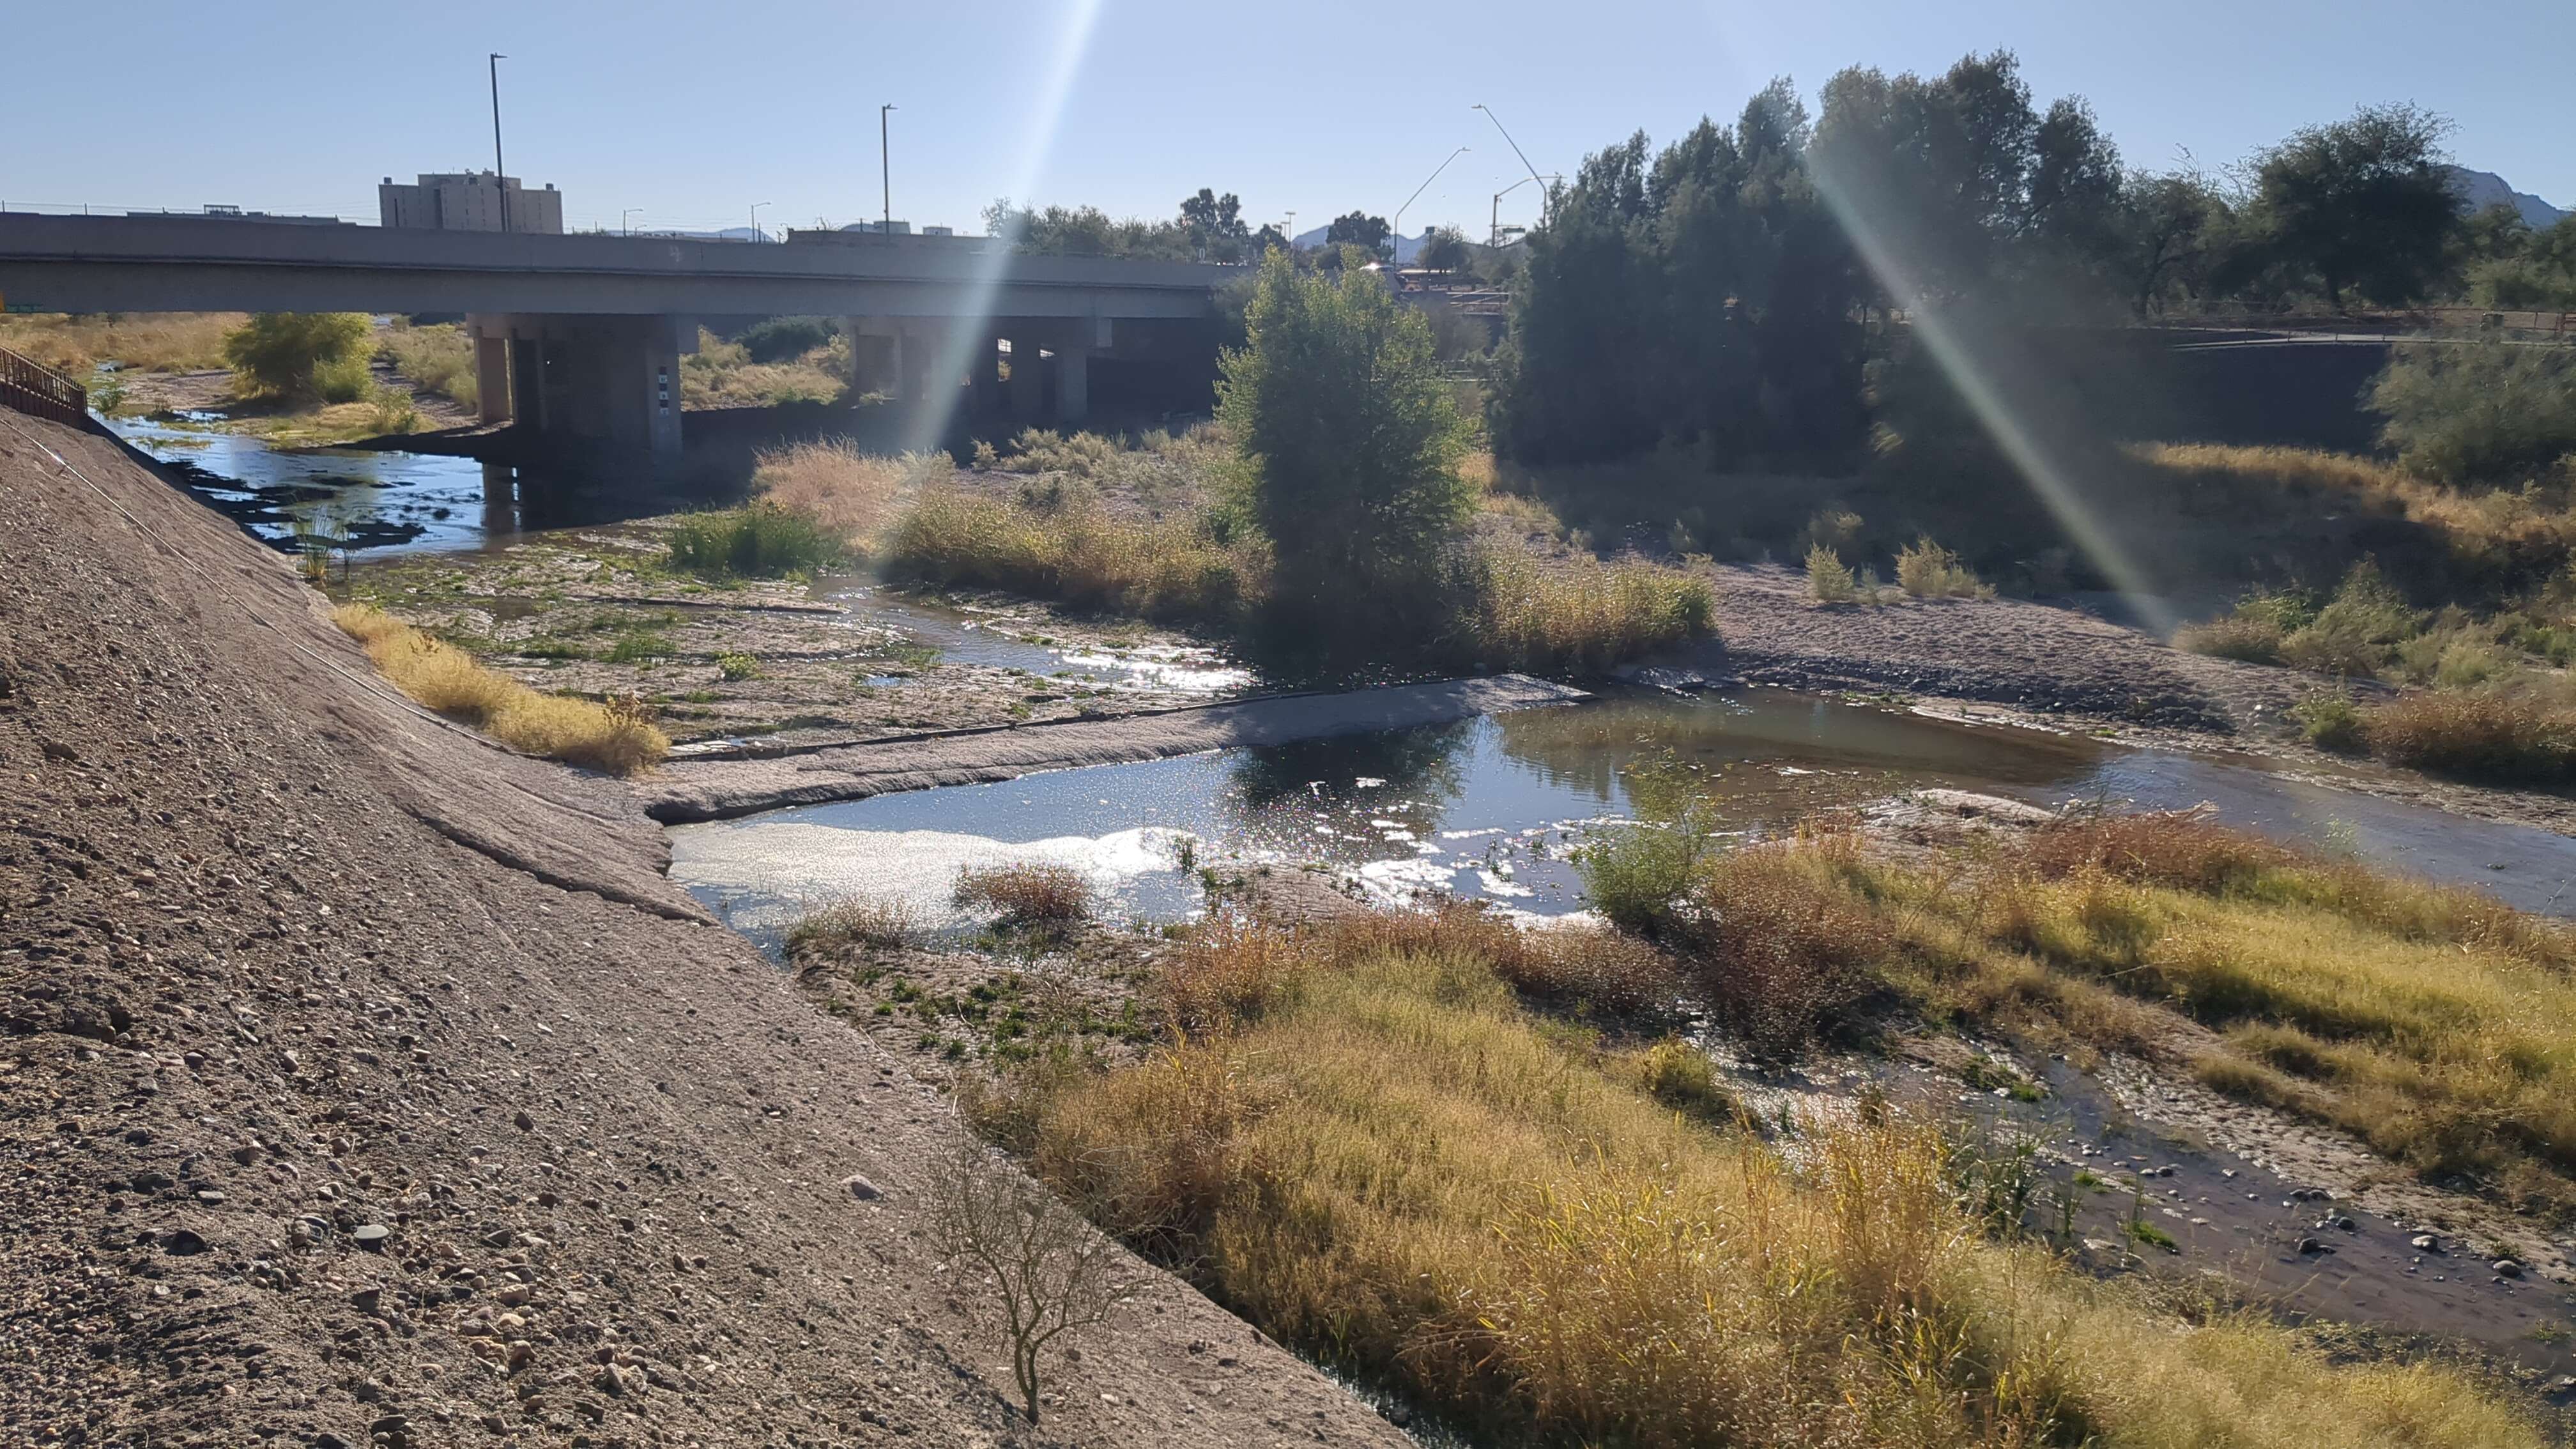
Santa Cruz River
The Santa Cruz River historically flowed year-round along many of the reaches through Tucson until 1941 and was home to many species of native fish, frogs, and other aquatic species. Over time, groundwater pumping caused water levels to decline, changing the flow to ephemeral (flowing only with rainfall) in the 1940s. At present, stretches of the Santa Cruz River flow perennially (year-round) in Tucson with the input of treated effluent. Many of these effluent release projects were developed to recharge water in the aquifer to store for future use. Consistent flow in the river has also created a riparian habitat along certain stretches. This habitat supports native fish and other wildlife and is enjoyed by surrounding neighborhoods, cyclists, and pedestrians on The Loop recreational multi-use path.
Santa Cruz River at Starr Pass Boulevard
Flow365 Monitors: Hannah Tanquary, Abby Aquino
2025 Water Year Flow: 220 Days
2024 Water Year Flow: 365 Days
2023 Water Year Flow: 365 Days
2022 Water Year Flow: 323 Days
2021 Water Year Flow: 365 Days
This half-mile to one-mile stretch along the Santa Cruz River has been flowing consistently with the release of effluent, or treated waste water, from the Santa Cruz River Heritage Project since 2019. We collect flow data a quarter mile downstream of the release site4 along The Loop. The flow has transformed what was a barren sandy river bed into a blossoming riparian area. With valuable documentation from partners like the Sonoran Institute, the University of Arizona, and others, we know that native riparian plants like cottonwoods and willows have returned, and the flow also supports populations of wildlife like fish, frogs, birds, and dragonflies.
Our monitors at this location have taken incredible photos and collected data to share, but one thing that has captured our attention this water year is that there was not surface flow year-round. In fact, this typically-perennial site had flow only 60% of the water year. Less flow has only occurred one other time since we began collecting data (2021), but it was not this extreme. In 2025, the lack of flow occurred during the warmer months of the water year (May - August). The decrease in discharge of reclaimed water (now pumped groundwater) by Tucson Water impacts the flow extent along this stretch of the river.
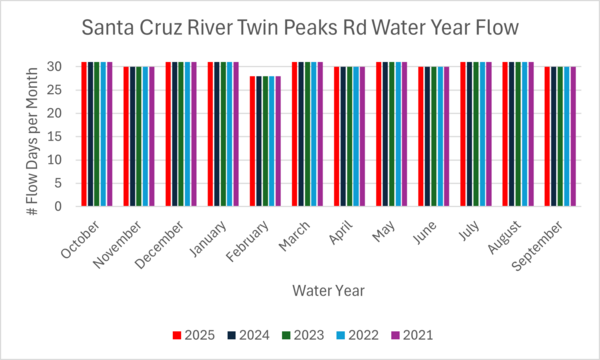
Santa Cruz River at Twin Peaks Road Water Year Flow Days
Flow365 Monitors: Nancy Grosvenor
2025 Water Year Flow: 365 Days
2024 Water Year Flow: 365 Days
2023 Water Year Flow: 365 Days
2022 Water Year Flow: 365 Days
2021 Water Year Flow: 365 Days

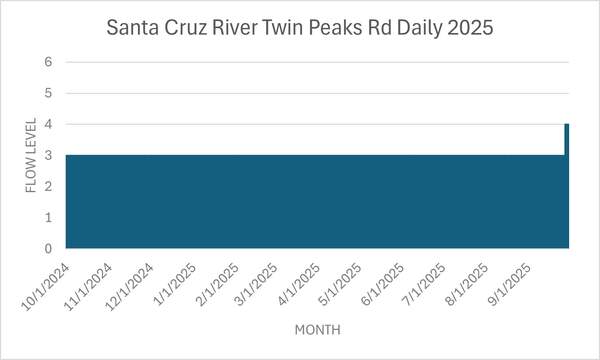
Santa Cruz River at Twin Peaks Road 2025 Water Year Flow
Daily estimated flow levels during the 2025 Water Year along Santa Cruz River at Twin Peaks Road
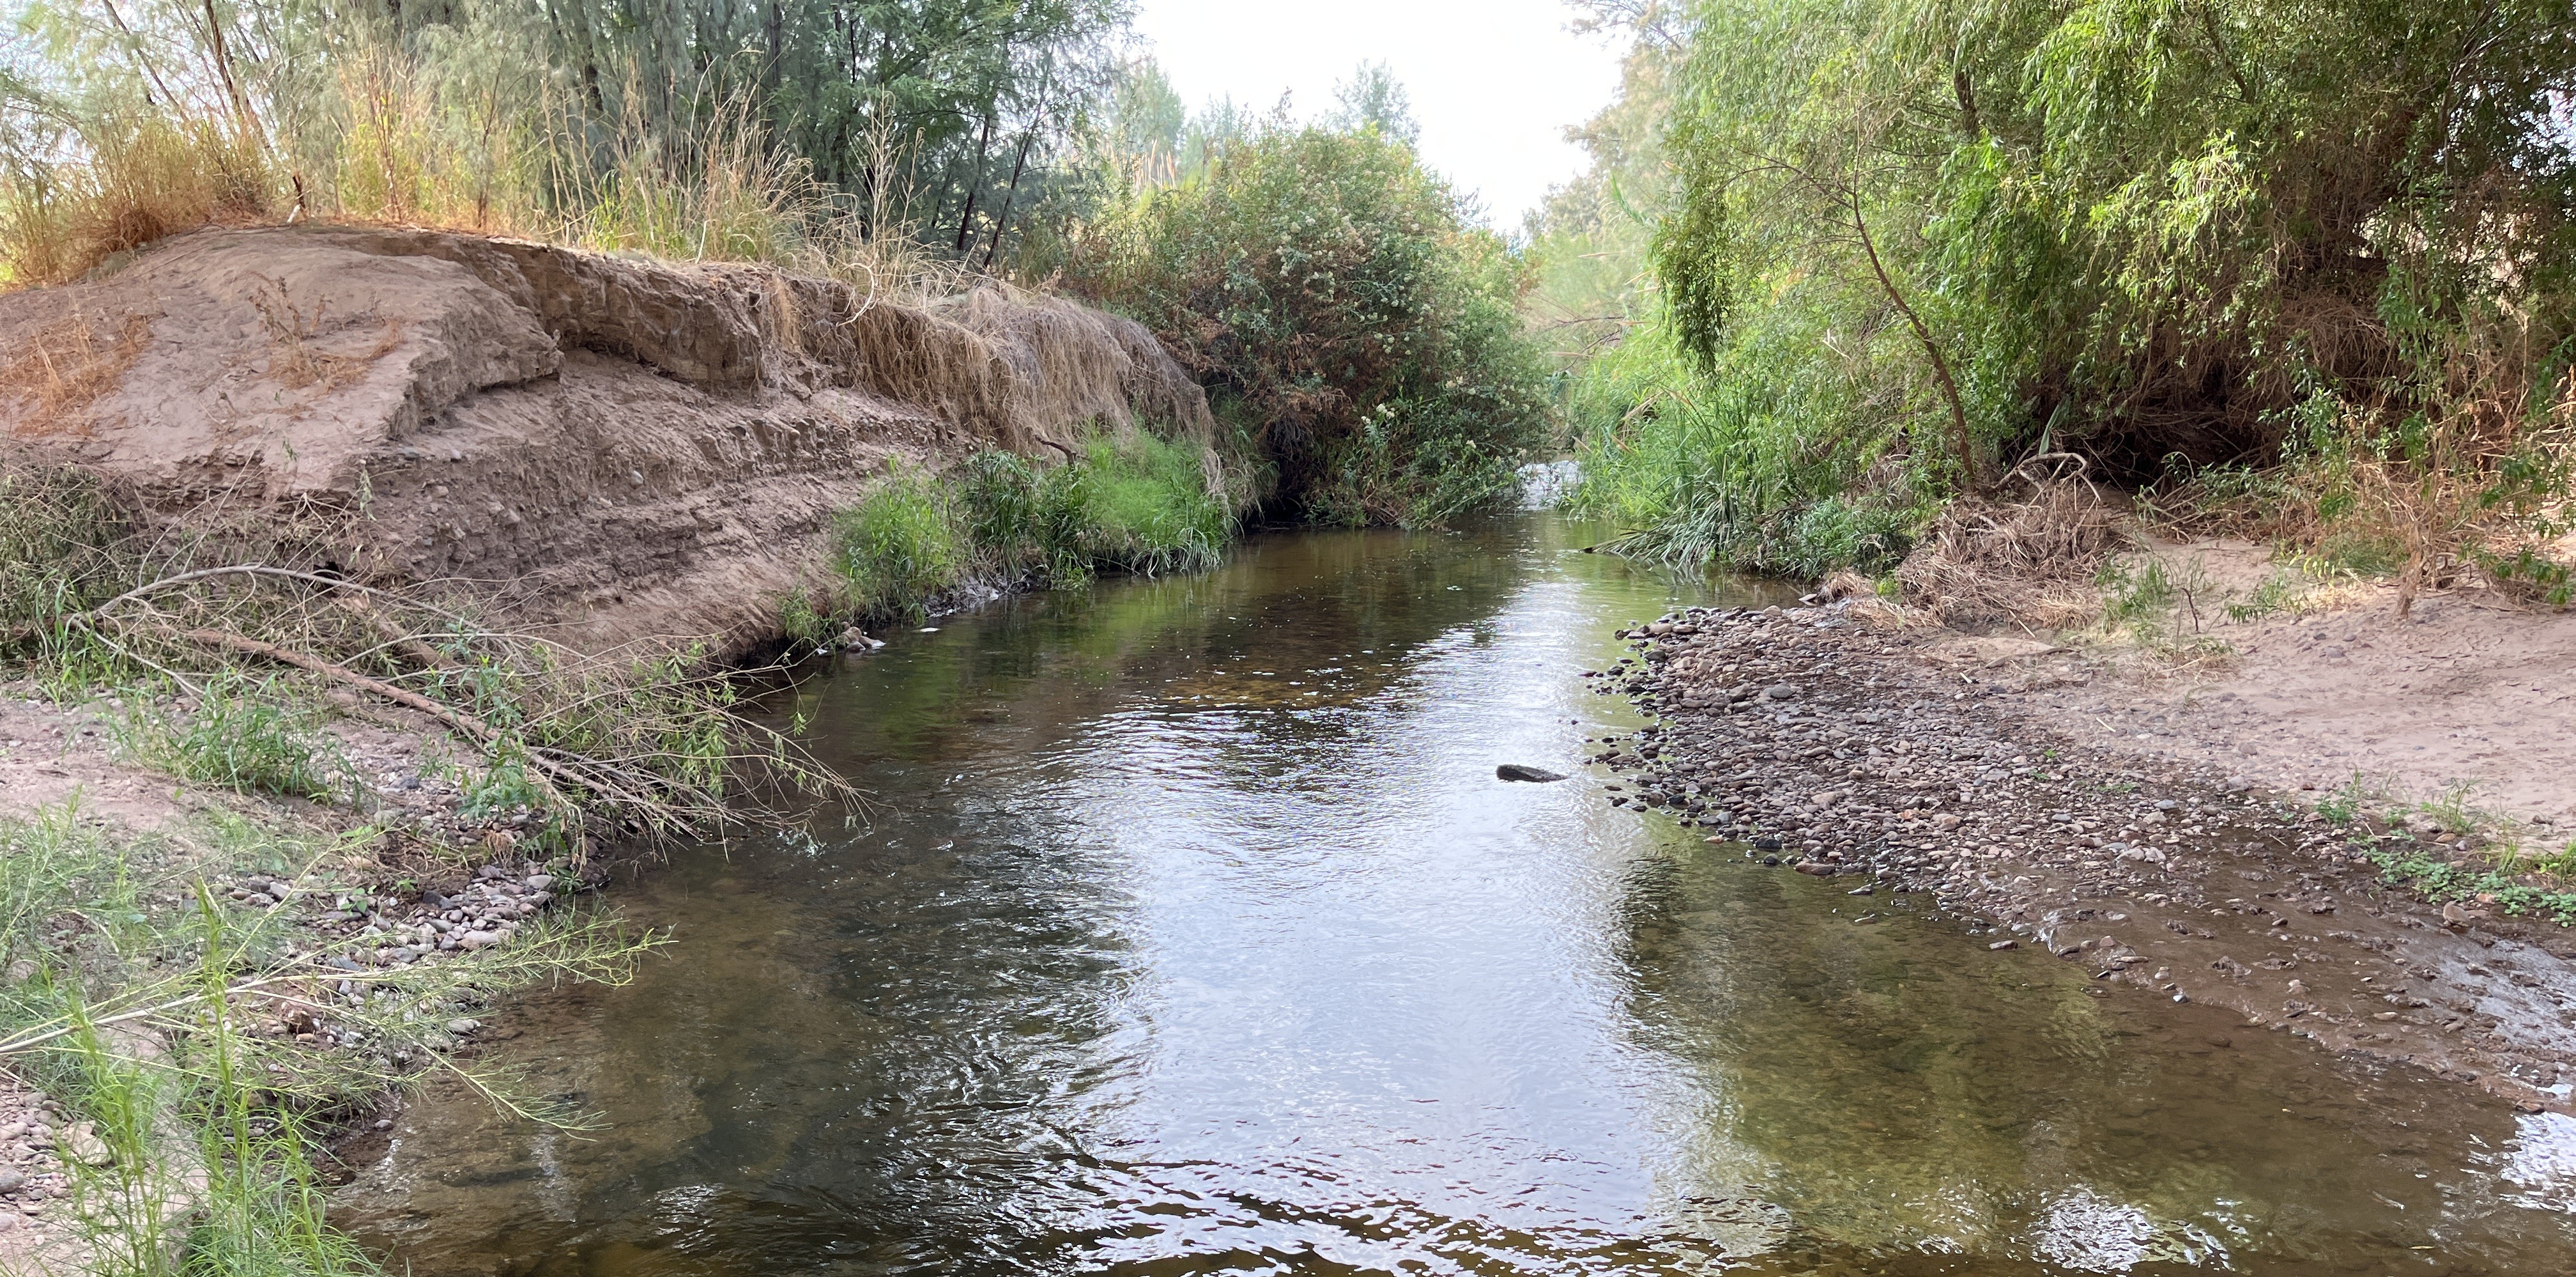
As we continue downstream, we reach Twin Peaks Road, where a single Flow365 monitor has been consistently collecting data since 2021. The effluent flow released at Ina Road reaches here and heads all the way north to Marana, flowing beyond Trico Road, where we have our northernmost monitoring location along this river. Flow365 Monitor Nancy Grosvenor, often accompanied by her dog, enjoys going down to this site to collect data and explore the area. The portion of the channel is very narrow, but there is still room for fish to swim in the water, and you can often see swallows nesting under the bridge.
This site is visited often in our creek walk series “Santa Cruz River Flows,” where the River Run Network invites community members to join our staff on guided walks to explore riparian ecosystems supported by recycled water flow areas along the Santa Cruz River. At this water year’s creek walk in July 2025, we heard from Pima County Flood Control representatives about the updates coming to this part of the creek. Due to undercutting of the current cement structures, excessive trash, and prolific invasive species presence, there will be new soil cement structures to change water flow direction, a wildlife ramp, and revegetation (3). You can learn more about this project here.
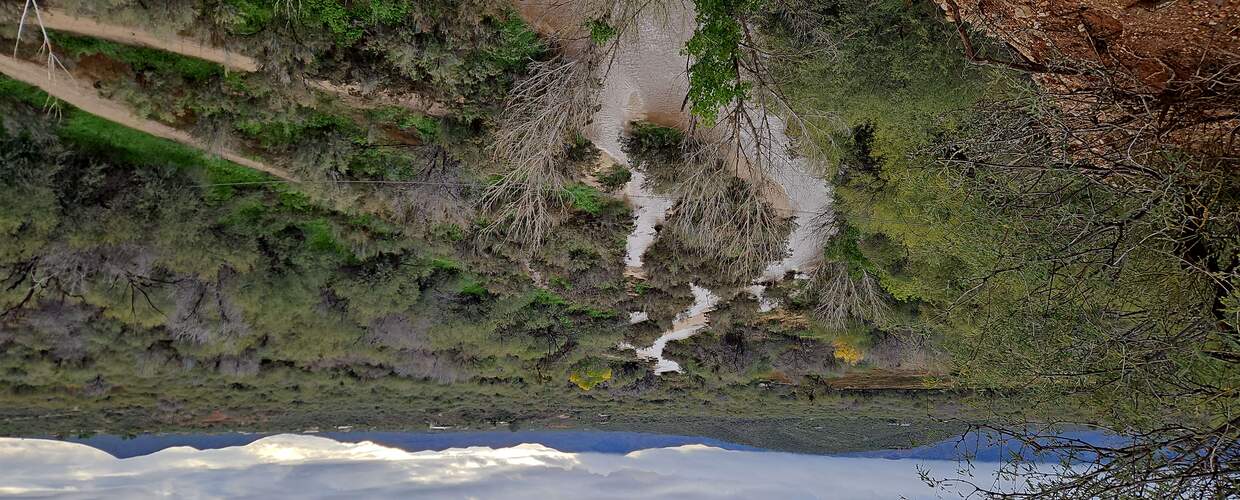
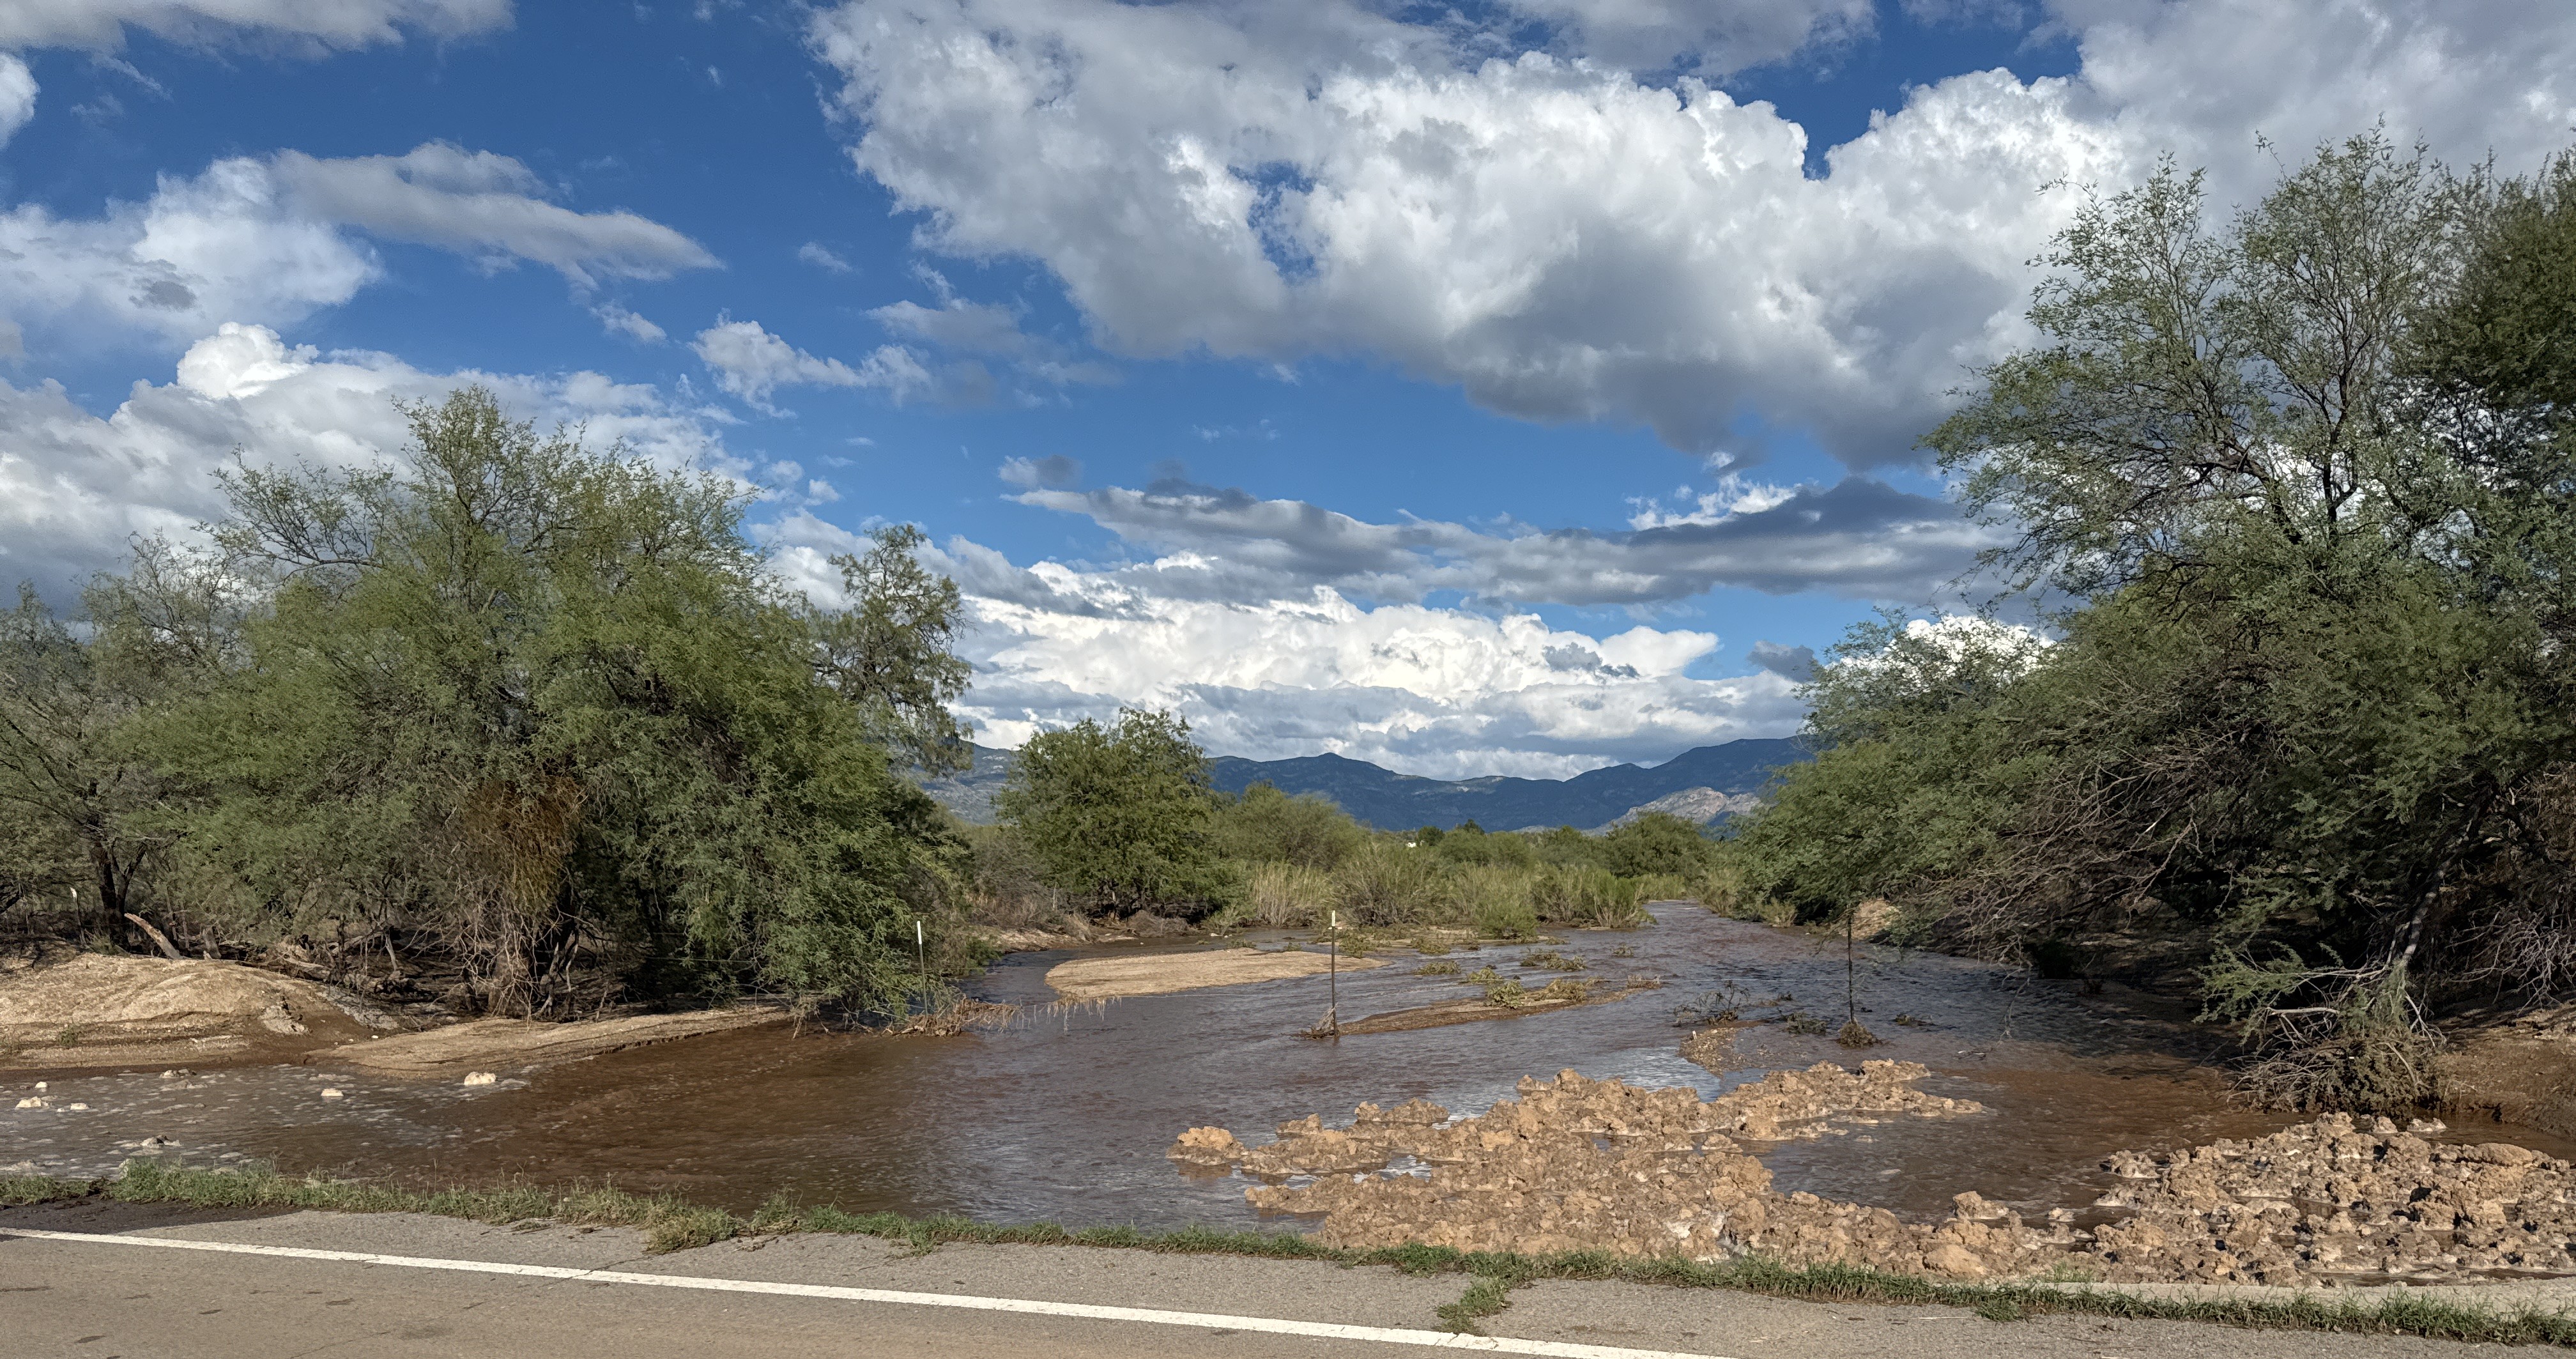
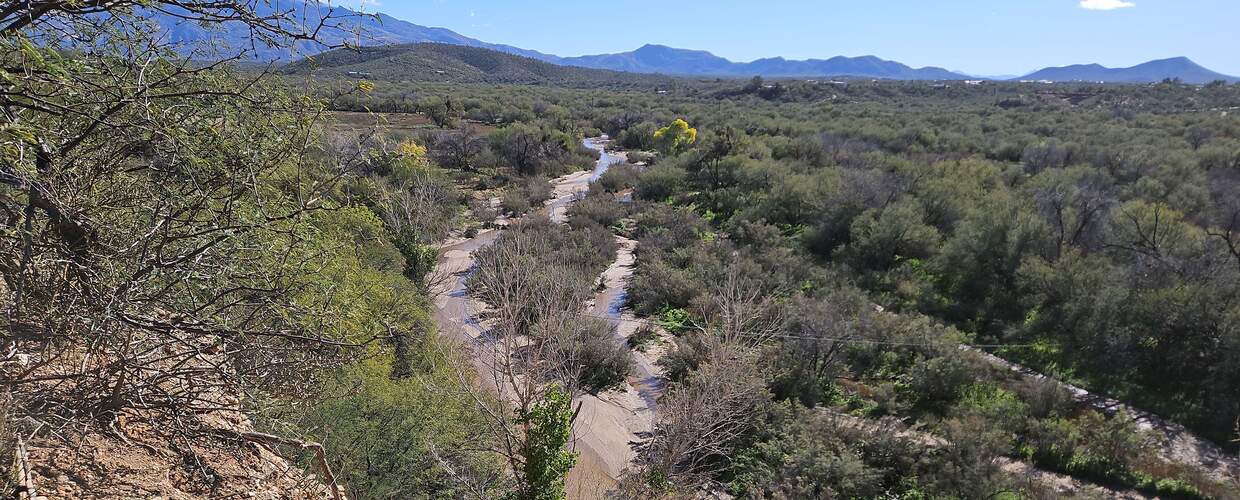
Rincon Creek
Rincon Creek begins near Rincon Peak, flowing west and eventually connecting to the Pantano near Vail, AZ. This creek is nestled between Saguaro National Park, private lands, and Pima County property. Rincon Creek is a hidden riparian oasis filled with cottonwoods and willows, home to important bird habitat and space for native animals to thrive. Recently, thanks to a generous donation from internationally renowned conservationist Hansjörg Wyss, Trust for Public Land was able to add nearly 300 acres of prime saguaro habitat to the park, including a mile and a half of the creek, nearly doubling its protected length.2
In some places, Rincon Creek is considered semi-perennial due to its dependence on groundwater for surface flow. Nestled into the top of the Rincon Creek valley is a shallow aquifer. When this aquifer is full, the groundwater is high enough to express itself as surface flow. This flow can last for many years if the aquifer continues to be replenished with enough rain and snowmelt. However, if the aquifer is depleted, it will flow only underground.
Rincon Creek at Camino Loma Alta Water Year Flow Days
Flow365 Monitors: Denice Smith
2025 Water Year Flow: 4 Days
2024 Water Year Flow: 15 Days
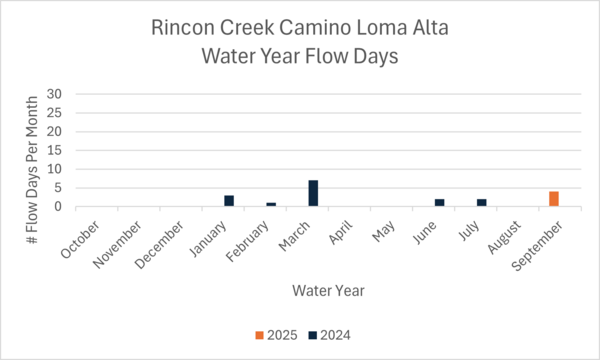
We began monitoring the Camino Loma Alta area in the latter part of the 2023 water year thanks to an interested community member who had been watching the flow for quite some time. Although the upper portions of Rincon Creek are considered perennial, much of middle and lower Rincon Creek is intermittent or even ephemeral, only flowing with rainfall input. As indicated by the Water Year Flow Days graph, the Camino Loma Alta site along Rincon Creek has not flowed very often over the last two water years. However, with consistent input and aquifer recharge in the upper portions of the creek, we may see it flow more often in the coming water years.
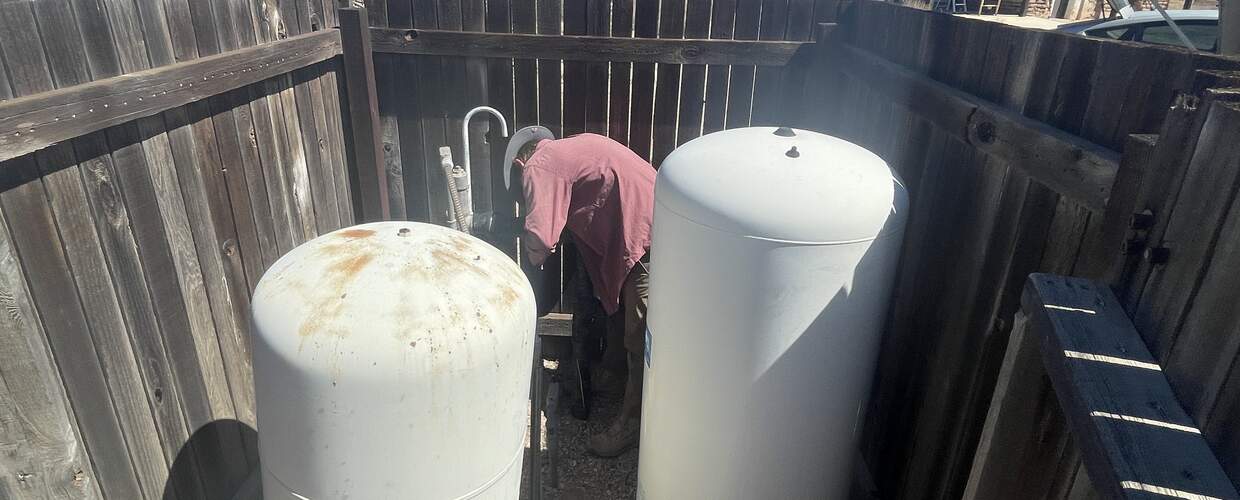
Flow365 Underground Well Data
The Flow365 Monitoring Program has been able to record groundwater levels in a few key areas thanks to private well owners. Connecting surface water data and nearby groundwater level data helps us to gain a working knowledge of this dynamic hydrologic relationship. Even if many of our creeks and rivers are not flowing on the surface, there is still water present and flowing underground that can be measured through groundwater wells. With this data, we are able to understand just how quickly these areas can respond to slower, gentler flows like snow melt and winter rains and identify the seasonal and annual trends which support riparian forests across our city. Currently, we have well data for the 2025 water year from areas along Sabino Creek, Rincon Creek, and Agua Caliente Creek. In 2026, we will be expanding the number of monitoring sites thanks to our partnership with and sponsorship from Pima County Regional Flood Control District.
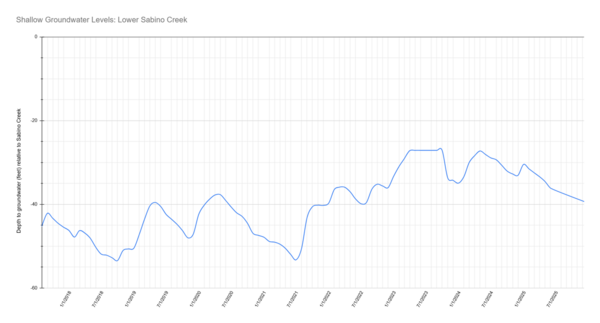
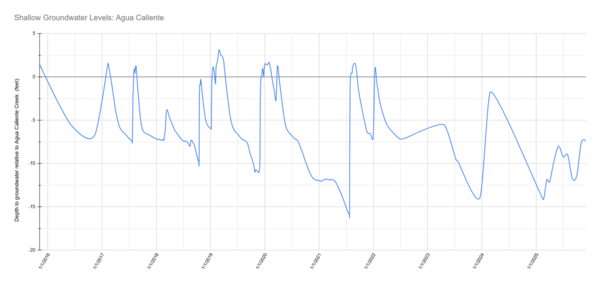
The graphs which follow show depth to groundwater relative to the nearby creek. The top of the vertical axis of these graphs is labeled with a zero and represents an estimation of the nearby channel bed surface to the monitoring well water levels. Note that these wells are near the creek but elevated topographically, so the elevation difference is an estimate with a small margin of error. Negative water level depth numbers represent how far below the ground surface the water level is (ie -20ft is 20 feet below the surface). In these wells’ historical data, there is a general upward trend over the years of water levels coming closer to the surface. This trend may indicate a gradual recovery of the aquifer in these areas since 2000. This may be due to a decrease in groundwater pumping, above average rain during some water years, and better water saving practices across the basin.
For the 2025 water year, we do see a decline in water levels (an increase in depth below the surface). This decline is due to the drought conditions during this water year. With less-than-average rain and above-average heat, the water levels in these areas were not replenished with winter snow-melt runoff or summer monsoon rains, and that lack of recharge is evident in the data collected at these wells.
Sabino Creek near Cloud Road
This area is considered a shallow groundwater area, which means water is within 50 feet of the surface. Based on the data collected in this area, the water levels have ranged from 47 feet to 23 feet below the surface between 2018 and 2025. With little to no rain at the beginning of the 2025 Water Year, the water levels were slowly declining (dropping farther below the surface). Unlike last water year (2024), when we had rain to replenish the aquifer in late January 2024, we did not receive enough rain this water year to see the levels replenish. This difference between 2024 and 2025 shows a strong correlation between rainfall and the groundwater recharge we see in our rivers.
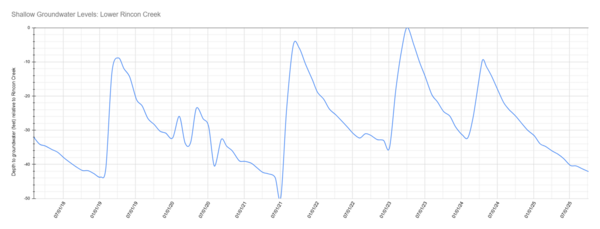
Rincon Creek near Camino Loma Alta
The Flow365 well near Camino Loma Alta is located near the base of the Rincon Mountains near lower Rincon Creek. The landowner has been collecting monthly data since September 2002, a period of over 20 years within our multi-decadal drought. The general trend until 2025 had been a gradual rise in water levels, which shows promise for continued recovery of this important shallow groundwater area. However, over the entire 2025 water year, the water levels were slowly decreasing. This decrease during the most recent water year correlates with the low rainfall and the surface flow levels we saw in this area. With only 4 days of surface flow this water year, there was little replenishment of groundwater.
Agua Caliente near Milagrosa Lane
The well along Agua Caliente Creek is located on the east side of Tucson. The landowner has been collecting data since September 2016, showing us some interesting trends over the last decade. The predominant trend is variability in water level due to the seasons, with increases in water levels during the winter and monsoon rainy seasons and declines during the warmer months or drought periods. Unfortunately, there were few observations in the 2024 Water Year leaving a gap of data between February 2024 to February 2025 during an intense drought period. In February 2025, WMG installed a water level probe that now provides regular data.
Thank you for reading our Flow365 Annual Report, we look forward to gathering more data and presenting reports in the years to come.
References:
- Sonoran Institute. “Living River Charting Santa Cruz River Conditions.”
https://sonoraninstitute.org/files/Living-River-Downtown-Tucson-to-Marana-2021-WY.pdf Accessed September 19, 2022. - “Rincon Creek | Saguaro National Park - Our Work in Az.” Trust Public Land, www.tpl.org/our-work/rincon-creek-saguaro-national-park. Accessed 18 Dec. 2025.
- Pima County. “Santa Cruz River Cortaro Narrows Training Structures.” Pima County, AZ, www.pima.gov/3215/Santa-Cruz-River-Cortaro-Narrows-Trainin. Accessed 29 Dec. 2025.
- Information and location of the Santa Cruz River Heritage Release Site along the Loop: https://www.tucsonaz.gov/Departments/Water/Community-Relations/The-Santa-Cruz-River-Heritage-Project#:~:text=The%20Santa%20Cruz%20River%20Heritage%20Project%20outfall%20(where%20the%20treated,from%20the%20Chuck%20Huckleberry%20Loop.